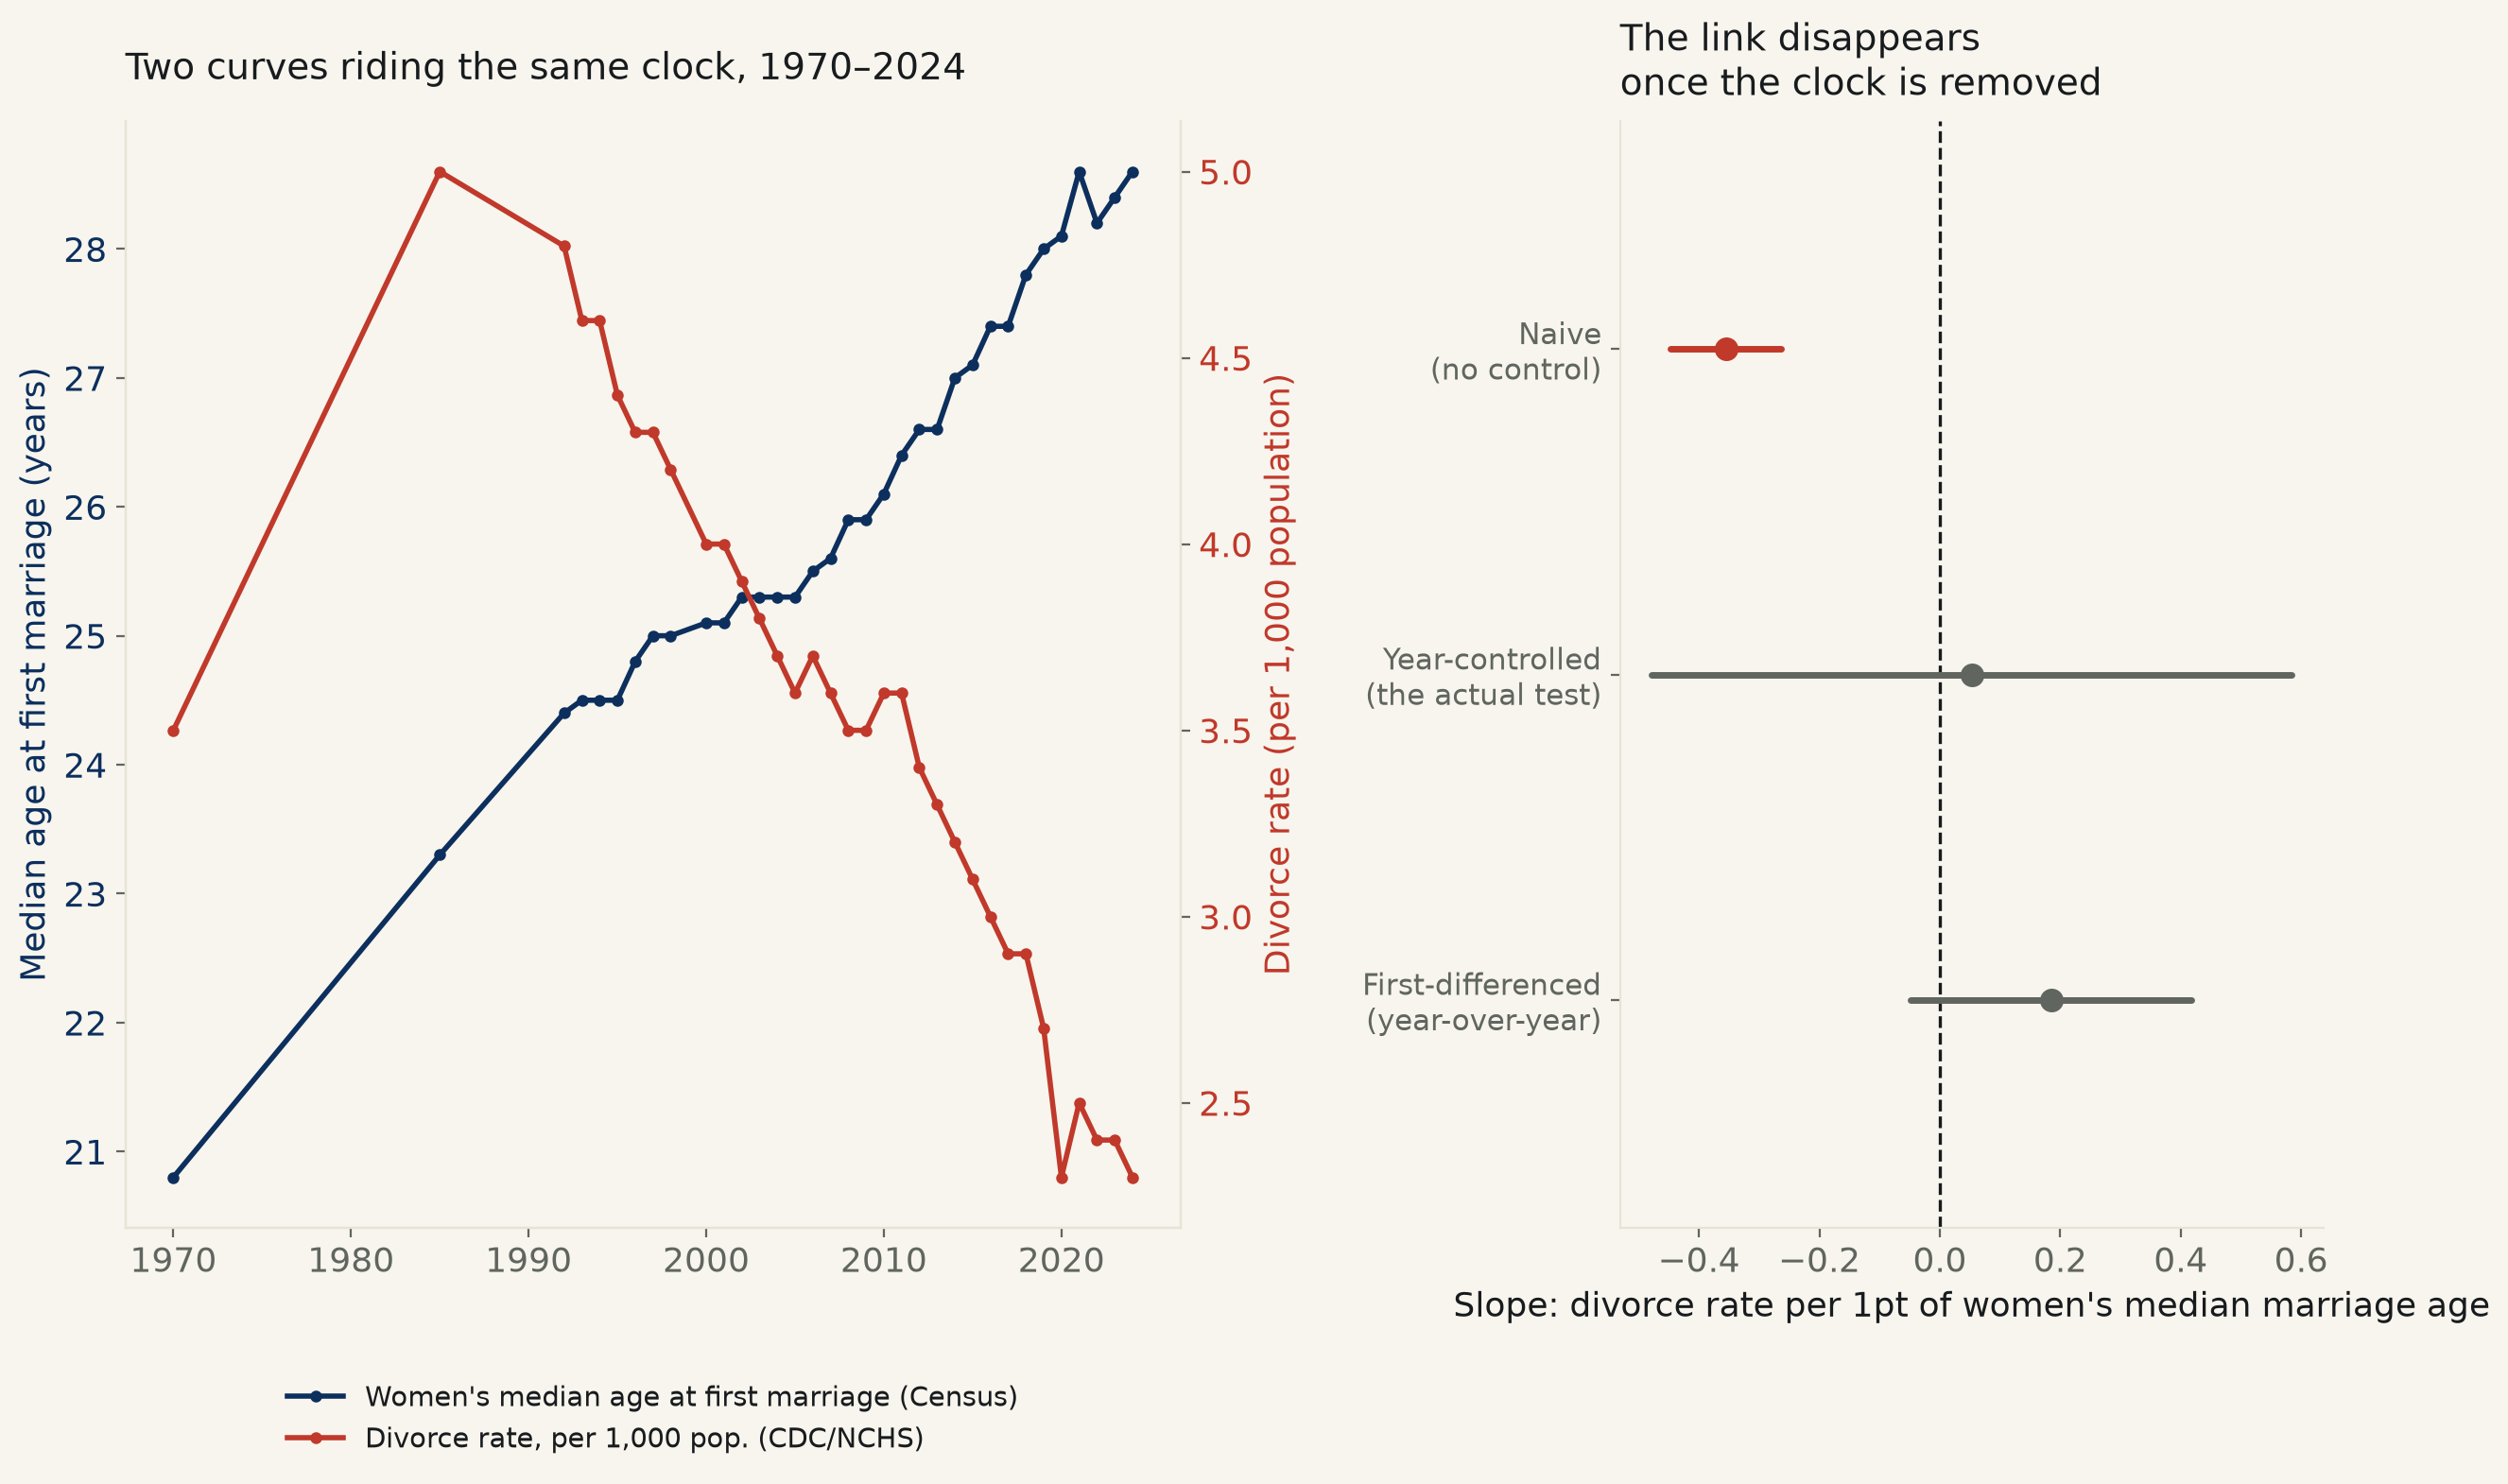
Bench idea, tagged [U-curve]: does age at marriage predict divorce? 34 years of US national data, 1970–2024: Census's own median age at first marriage against CDC/NCHS's own national divorce rate. Naive slope: -0.3552 divorce-rate points per year of marriage age, 95% CI [-0.4470, -0.2634] — excludes zero. Controlling for calendar year: +0.0529, CI [-0.4780, +0.5838] — contains zero.
The claim this bench idea names has a famous individual-level version: people who marry very young, or very old, both carry elevated divorce risk, with a lower-risk band in between — a shape researchers call a U-curve. Testing that directly needs case-level survey data tracking real marriages to their outcomes (the literature's own source is NSFG, the National Survey of Family Growth, restricted-format microdata not reachable keylessly in a day). What both of the idea's own named sources, CDC and Census, DO support is the aggregate version: did the national rise in age at first marriage track the national fall in the divorce rate, at all — and if it did, is that two real trends connected to each other, or just two numbers that each happen to move with the calendar.
The naive answer is about as clean a correlation as this desk sees: −0.355 divorce-rate points per added year of women's median marriage age, 95% CI [-0.4470, -0.2634] — excludes zero, R²=0.660. Men's median age, a separately reported Census series, gives nearly the identical answer, -0.3671, CI [-0.4611, -0.2731] — this isn't an artifact of picking one sex's column. HC3-robust SE and a Spearman rank correlation (ρ=-0.929, p=2.2e-15) both agree with the naive fit.
But marriage age and calendar year move together almost perfectly over this window — Pearson r=0.986 between women's median age and the year itself, 1970-2024. Put year into the same regression, and women's age's own coefficient flips sign and contains zero: +0.0529, 95% CI [-0.4780, +0.5838] — men's age does the same, -0.0671, CI [-0.4904, +0.3562]. A nested F-test makes the point more sharply than the wide CI alone: a model with only calendar year already explains R²=0.6852 of the variance in the divorce rate; adding women's marriage age on top raises that to only R²=0.6856 — age buys essentially nothing once year is already in the model, F=0.041, p=0.84.
A first-differenced check sidesteps the collinearity problem entirely by looking only at year-over-year moves — does a year in which marriage age rose unusually fast also see the divorce rate fall unusually fast, net of the shared smooth trend? Across 30 consecutive-year pairs, the answer is no: slope +0.1847, 95% CI [-0.0487, +0.4181] — contains zero, and the point estimate actually runs positive, the wrong direction for the claim.
Read plainly. The naive national correlation is real and large, but every test built to separate "age predicts divorce" from "both numbers happen to move with the calendar" comes back empty. This run cannot speak to the individual-level U-curve at all — it never had the data to. What it can say is that the loud aggregate version, the one actually reachable from CDC and Census's own published tables, is fully explained by time itself.
| Specification | Slope, divorce rate pts/1yr age | 95% CI | Fit | Verdict |
|---|---|---|---|---|
| Naive, women's age, no control (n=34) | -0.3552 | [-0.4470, -0.2634] | R²=0.660 | excludes zero, p=5.4e-09 |
| Naive, women's age, HC3-robust SE (n=34) | -0.3552 | [-0.6605, -0.0499] | R²=0.660 | excludes zero |
| Naive, men's age, no control (n=34) | -0.3671 | [-0.4611, -0.2731] | R²=0.664 | excludes zero, p=4.5e-09 |
| Year-controlled, women's age (n=34) | +0.0529 | [-0.4780, +0.5838] | R²=0.686 | contains zero, p=0.840 |
| Year-controlled, men's age (n=34) | -0.0671 | [-0.4904, +0.3562] | R²=0.686 | contains zero, p=0.749 |
| First-differenced, year-over-year (n=30) | +0.1847 | [-0.0487, +0.4181] | R²=0.086 | contains zero, p=0.116 |
Method. Median age at first marriage: US Census Bureau Table MS-2, "Estimated Median Age at First Marriage, by Sex: 1890 to Present" (Current Population Survey, Annual Social and Economic Supplement), fetched live as the Bureau's own published .xls. Divorce rate: two pieces of the same underlying NCHS vital-registration series, merged and named as such — CDC/NCHS's own current national table (cdc.gov/nchs/data/dvs/marriage-divorce) covers 2000-2024 directly; 1970-1998 (sparse: 1970, 1985, 1992-1998) comes from Our World in Data's "divorces-per-1000-people" grapher, sourced to the OECD Family Database, confirmed to agree with the NCHS table to within 0.001 points on every one of 22 overlapping years before being trusted for the extension. Both variables are annual national aggregates — this is an ecological, same-year time-series design, not a cohort or survival analysis of individual marriages. The year-controlled specification adds calendar year as a linear covariate; the first-differenced specification regresses the year-over-year change in the divorce rate on the year-over-year change in marriage age, using only the 30 pairs of literally consecutive years on file, which removes the shared smooth trend without relying on the collinear year-control model.
Limits, stated plainly. This run cannot test the claim's actual, individual-level U-curve shape at all — that needs case-level marriage microdata (NSFG) this run did not reach, and even an aggregate null here is compatible with a real individual-level U-curve existing underneath it (ecological correlations and individual-level ones can diverge in either direction). The divorce-rate series itself is a crude rate (divorces per total population, not per married or marriageable population) and is a known partial count, not a full census of divorces: NCHS's own published national figures have long excluded several non-reporting states by name, California among them (confirmed directly against NCHS's own National Vital Statistics Reports, e.g. NVSR 57-19's own footnote, "Divorce figures exclude data for California, Georgia, Hawaii, Indiana, Louisiana, and Minnesota") — the same measurement caveat that applies to every NCHS marriage/divorce release cited elsewhere on this desk. 1970-2024 also spans the 1969-1985 nationwide rollout of no-fault divorce law, a specific, dateable policy shock entangled with the same clock as calendar year itself — this run's year control cannot separate "time passing" from "no-fault law spreading," only from "age at marriage changing."