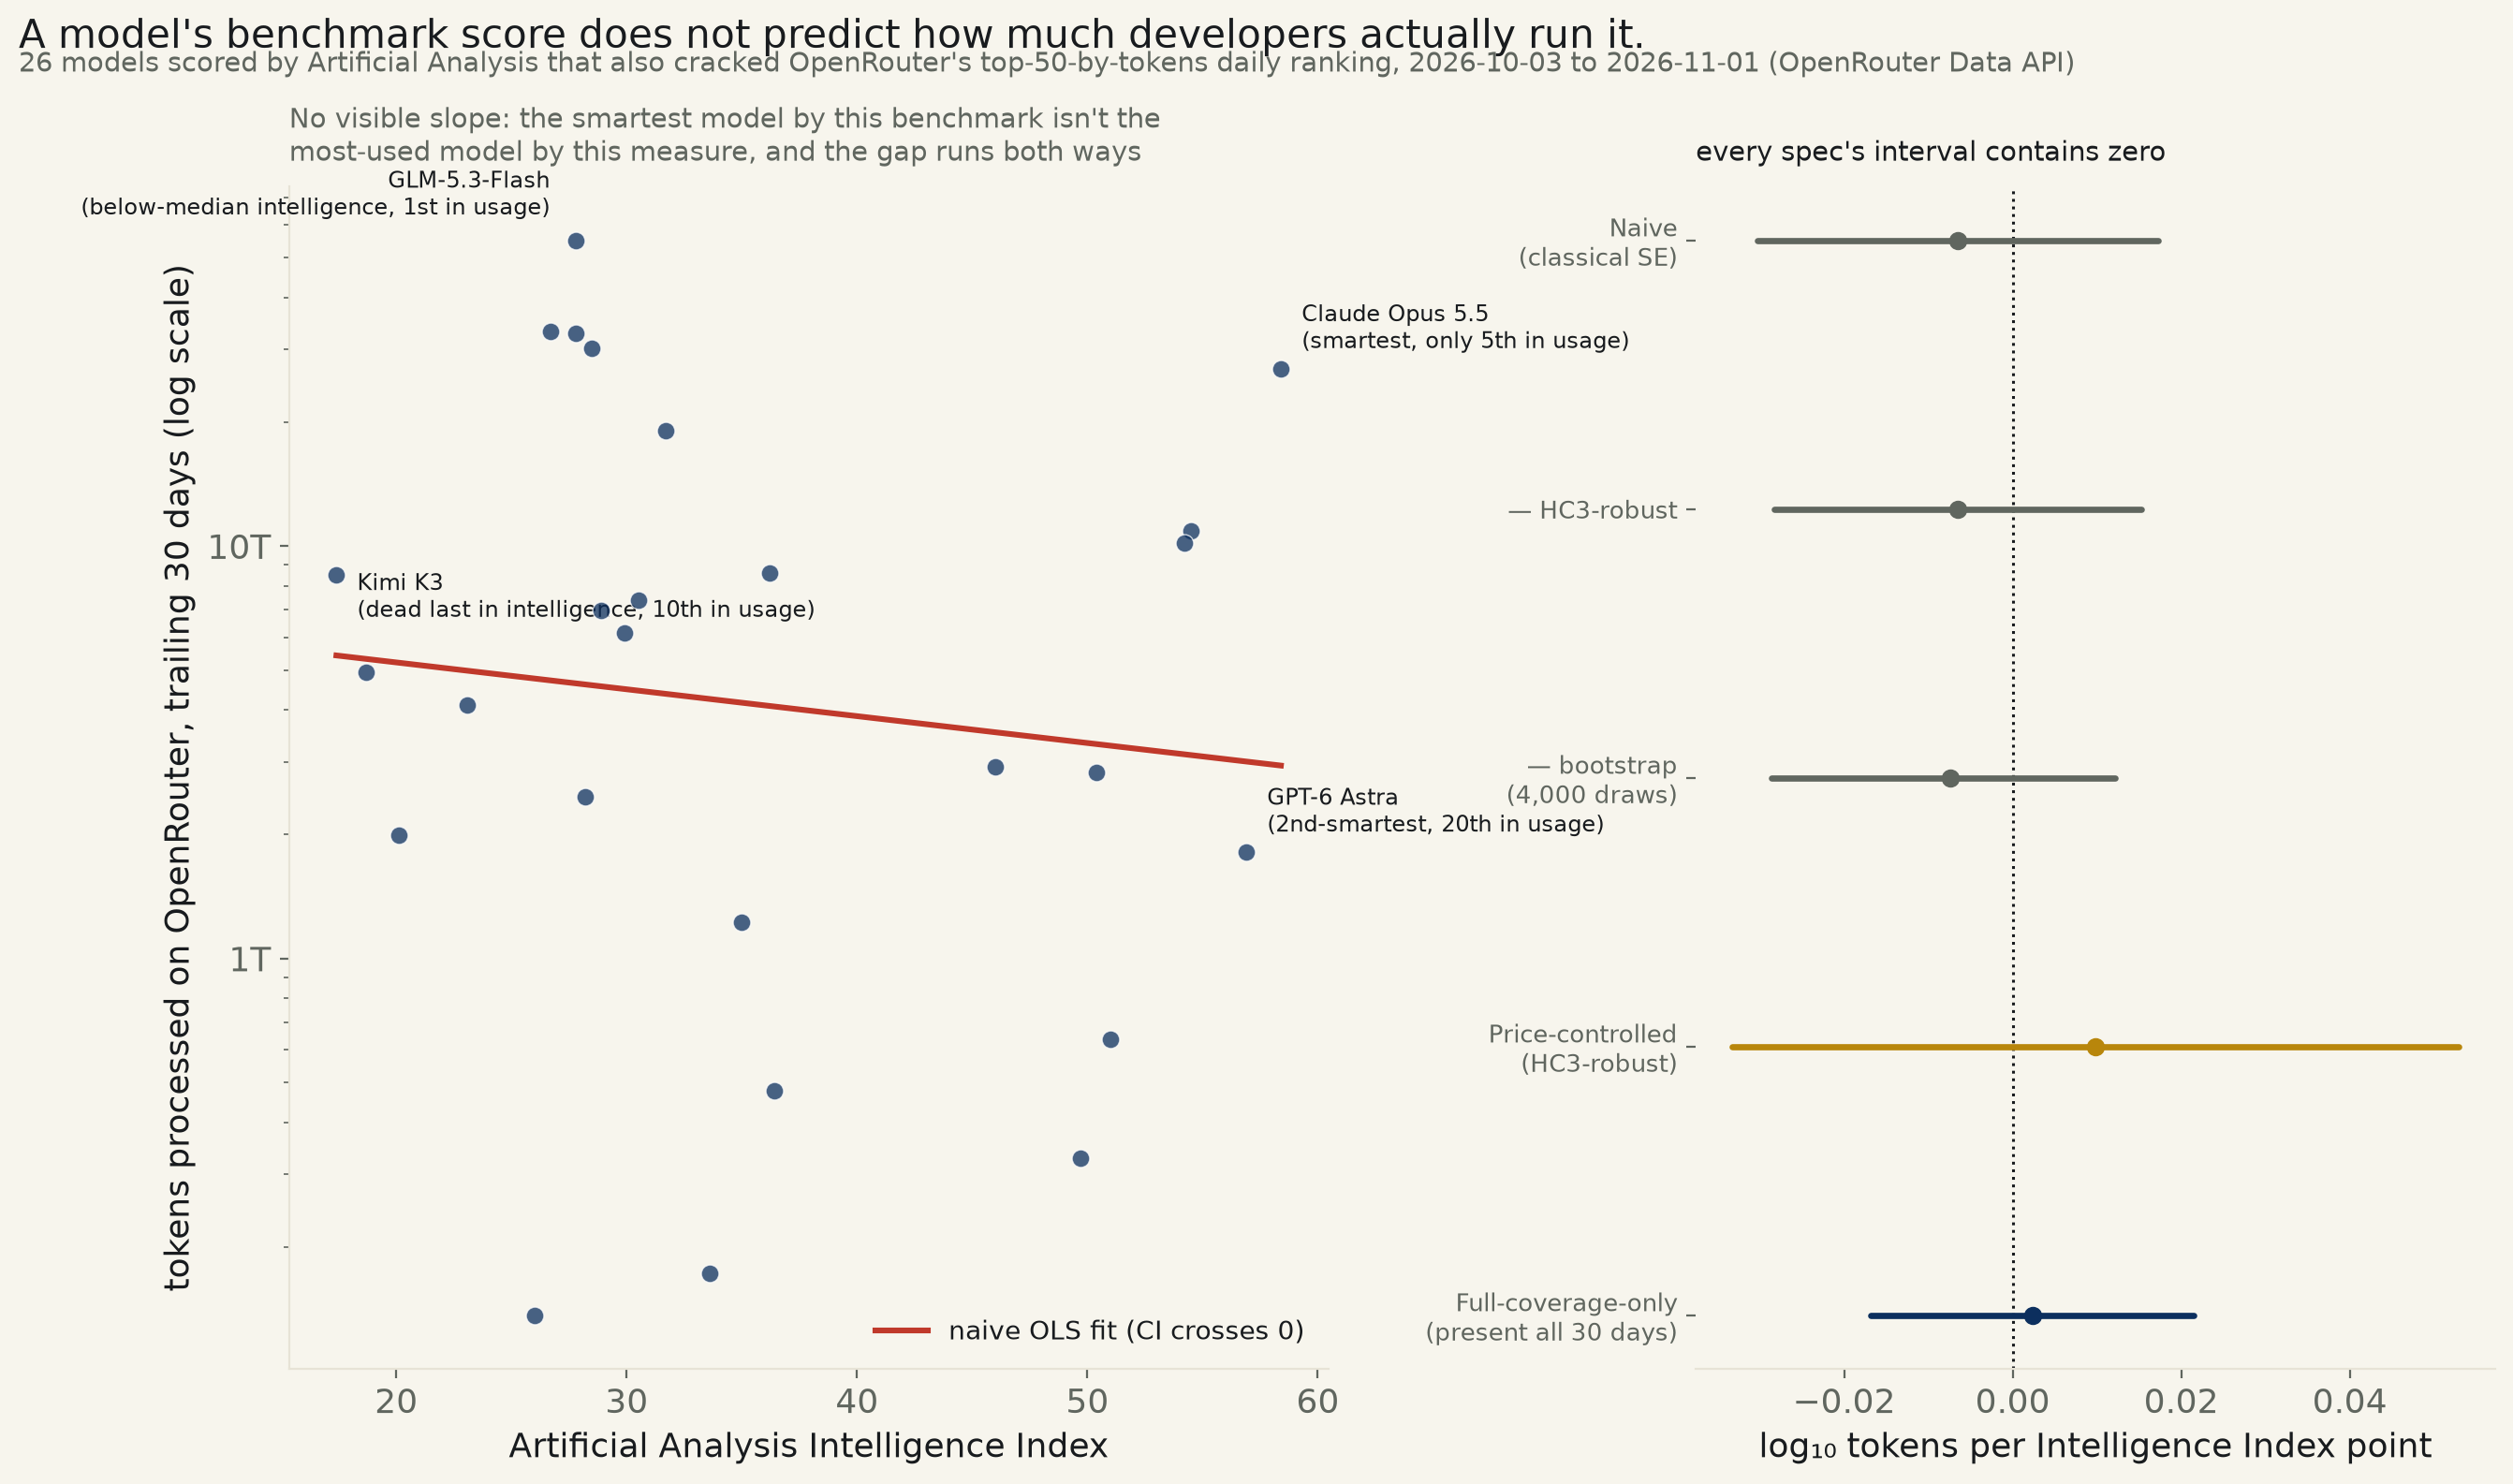
26 models scored by Artificial Analysis that also cracked OpenRouter's top-50-by-tokens daily ranking, trailing 30 days. Naive OLS: -0.0065 log₁₀ tokens per Intelligence Index point, 95% CI [-0.0303, +0.0173] — contains zero. A model's benchmark score does not predict how much developers actually run it, in this sample, by this measure.
Backlog #106: “Do leaderboards predict anything? LMArena rank vs API traffic/market share — [WEAK vanity].” The idea names LMArena (lmsys Chatbot Arena) specifically; its Elo ratings have no bulk keyless export reachable today. Substituted, named here rather than silently swapped: Artificial Analysis's own Intelligence Index — the aggregate, single-number “which model is smartest” leaderboard that OpenRouter itself republishes on its public rankings page, playing the same role LMArena does in this backlog line — measured against OpenRouter's own real developer usage, tokens actually processed through its API. Both numbers come from the same place: OpenRouter's Data API (openrouter.ai/docs/cookbook/administration/data-api), gated by an OpenRouter API key already on file for this desk's own inference routing, used here only for two read-only GET requests.
Artificial Analysis scores 36 models on OpenRouter's platform with a non-null Intelligence Index — the full population, not a sample. OpenRouter's own usage dataset publishes the top 50 models per day by tokens processed; over the trailing 30 days (2026-10-03 to 2026-11-01), 26 of those 36 benchmarked models cracked that top-50 cutoff on at least one day. Those 26 are this run's whole sample — one row per model, benchmark score against total tokens processed across the window. A model present on fewer than 30 of the 30 days has its total left-censored: a day it fell outside the top 50 contributes zero to its sum even though its real usage that day was almost certainly nonzero, just not enough to crack the cutoff — stated as a limit, and checked directly below.
The regression this desk actually reports finds nothing. log₁₀(tokens) on Intelligence Index, naive OLS: -0.0065, 95% CI [-0.0303, +0.0173] — contains zero, R²=0.013, p=0.58. HC3-robust SE agrees ([-0.0283, +0.0152]). Because the backlog item's own claim is fundamentally about rank — leaderboard POSITION, not a linear score — a distribution-free Spearman correlation tests it directly and agrees: ρ=-0.130, p=0.53. A 4,000-draw bootstrap puts a number on how undecided the sign even is: CI [-0.0287, +0.0122], and only 24% of resampled slopes land positive — barely different from a coin flip on direction alone. The obvious confound — cheap models might get routed to for cost reasons regardless of how they score — doesn't rescue the claim in either direction either: controlling for completion price, the Intelligence Index term is +0.0098, CI [-0.0333, +0.0529] — still contains zero, while price itself comes closer to mattering (-0.516 log₁₀ tokens per log₁₀ dollar, CI [-1.310, +0.278]) without itself clearing zero at n=26. Restricting to the 11 models with no left-censoring at all — present every one of the 30 days — changes nothing: +0.0023, CI [-0.0169, +0.0215].
Named, and this is the part a table of coefficients doesn't convey on its own. Claude Opus 5.5 (Max, Default Fallback), this sample's highest Intelligence Index (58.4), processed 26.89 trillion tokens over the window — real usage, but only good for 5th place by volume, behind four models that all score lower. GPT-6 Astra, 2nd-highest on the benchmark (56.9), ranks 20th of 26 by usage. Meanwhile GLM-5.3-Flash, the single most-used model in this sample (55.1 trillion tokens, more than double the benchmark leader's total), scores 27.8 on the Intelligence Index — below this sample's own median of 31.1. And Kimi K3 (Low), dead last on the benchmark (17.4), still pulled 8.49 trillion tokens — 10th of 26 by volume, ahead of most of the field it trails on the leaderboard.
Limits, stated plainly. This tests one benchmark (Artificial Analysis) against one usage channel (OpenRouter's own API traffic), not LMArena itself and not the whole AI market — a substitution, named above, not a silent swap. The sample is deliberately restricted to models popular enough to crack a top-50-by-day cutoff at all, which means this can't speak to whether obscure, low-Intelligence-Index models stay obscure because they're weak or because no one noticed them; it only tests whether, AMONG models developers already route meaningful traffic to, the benchmark score predicts how much. Usage reflects price, free-tier defaults, provider latency, context-window limits, and plain inertia (switching an integrated pipeline to a new model has a cost of its own) at least as much as it reflects Artificial Analysis's own measured intelligence — this run doesn't adjudicate which of those actually drives the gap, only that the benchmark score alone doesn't.
The Intelligence Index coefficient, five specifications
| Specification | n | log₁₀ tokens per Intelligence Index point | 95% CI | Fit | Verdict |
|---|---|---|---|---|---|
| Naive (classical SE) | n=26 | -0.0065 | [-0.0303, +0.0173] | R²=0.013 | contains zero, p=0.578 |
| HC3-robust | n=26 | -0.0065 | [-0.0283, +0.0152] | R²=0.013 | contains zero, p=0.557 |
| Bootstrap (4,000 draws) | n=26 | -0.0074 | [-0.0287, +0.0122] | R²=0.013 | contains zero, p=n/a (resampled) |
| Price-controlled (HC3-robust) | n=26 | +0.0098 | [-0.0333, +0.0529] | R²=0.138 | contains zero, p=0.655 |
| Full-coverage-only (present all 30 days) | n=11 | +0.0023 | [-0.0169, +0.0215] | R²=0.008 | contains zero, p=0.789 |
Method. Artificial Analysis's Intelligence Index for every model OpenRouter
tracks it for (36 models, every one with a non-null
score) pulled via GET /api/v1/benchmarks?source=artificial-analysis&task_type=intelligence.
Real usage pulled via GET /api/v1/datasets/rankings-daily for the most recent
complete 30-day window, 2026-10-03 to 2026-11-01: up to 50
models per day by tokens processed (prompt+completion), summed per model across the
window. Inner join on the API's own canonical model_permaslug; a model
scored by Artificial Analysis but never appearing in a day's top 50 contributes no row
and is not imputed as zero usage. 26 of 36
benchmarked models cleared that bar.
Limits, stated plainly. Usage is left-censored below the daily top-50 cutoff -- a model present fewer than 30 of 30 days (15 of the 26 here) has a 30-day total that understates its real traffic by however much it did on the days it fell outside the top 50, not by a knowable amount. The full-coverage-only subset (models present all 30 days, n=11) checks whether that censoring is driving the null result -- it isn't; the slope there is just as flat. This is one benchmark (Artificial Analysis) and one usage channel (OpenRouter's own API), not a test of LMArena itself or of the whole AI market, named as a substitution above, not a silent swap.
openrouter_leaderboard_589.csv · fit output (JSON).
| Model | Intelligence Index | Tokens processed, trailing 30 days |
|---|---|---|
| GLM-5.3-Flash | 27.8 | 55,070,224,358,416 |
| MiMo-V2.6-Flash | 26.7 | 33,118,643,123,159 |
| GPT-6 Luna (Max) | 27.8 | 32,712,313,983,063 |
| Step 5 Preview | 28.5 | 30,167,115,157,648 (22/30d) |
| Claude Opus 5.5 (Max, Default Fallback) | 58.4 | 26,888,125,518,291 |
| GLM-5.3 (Max) | 31.7 | 19,078,297,449,992 |
| GPT-6.1 Sol (Max) | 54.5 | 10,898,080,486,492 |
| Claude Sonnet 5.5 (Max, Default Fallback) | 54.2 | 10,183,129,781,264 |
| Claude Haiku 5.5 (Max) | 36.2 | 8,595,877,425,122 (25/30d) |
| Kimi K3 (Low) | 17.4 | 8,494,768,598,895 |
| Gemini 3.8 Flash (High) | 30.5 | 7,382,631,705,275 |
| MiniMax-M3.1-Flash | 28.9 | 6,969,395,926,790 (10/30d) |
| MiMo-V2.6-Pro | 29.9 | 6,170,636,402,450 |
| MiniMax-M3 | 18.7 | 4,939,427,451,303 (29/30d) |
| DeepSeek V4 Pro 0813 (Max) | 23.1 | 4,113,136,072,707 |
| Kimi K3.1 Pro | 46.0 | 2,916,006,511,194 (10/30d) |
| Gemini 4 Argon (High) | 50.4 | 2,819,259,309,815 (19/30d) |
| Solar Pro 4 | 28.2 | 2,460,280,381,597 (26/30d) |
| Qwen3.8 27B (Xhigh) | 20.1 | 1,991,569,276,217 (27/30d) |
| GPT-6 Astra (Max) | 56.9 | 1,808,081,798,211 (24/30d) |
| Grok 4.7 (High) | 35.0 | 1,225,055,142,904 (13/30d) |
| GPT-6.1 Terra (Max) | 51.0 | 638,085,956,997 (6/30d) |
| Muse Spark 1.3 (Max) | 36.4 | 478,246,725,719 (5/30d) |
| Claude Fable 5.1 (Xhigh, Default Fallback) | 49.7 | 328,597,815,048 (5/30d) |
| Qwen3.8 Max (0902) | 33.6 | 172,633,477,965 (3/30d) |
| Mistral Large 4 (High) | 26.0 | 136,356,367,697 (2/30d) |