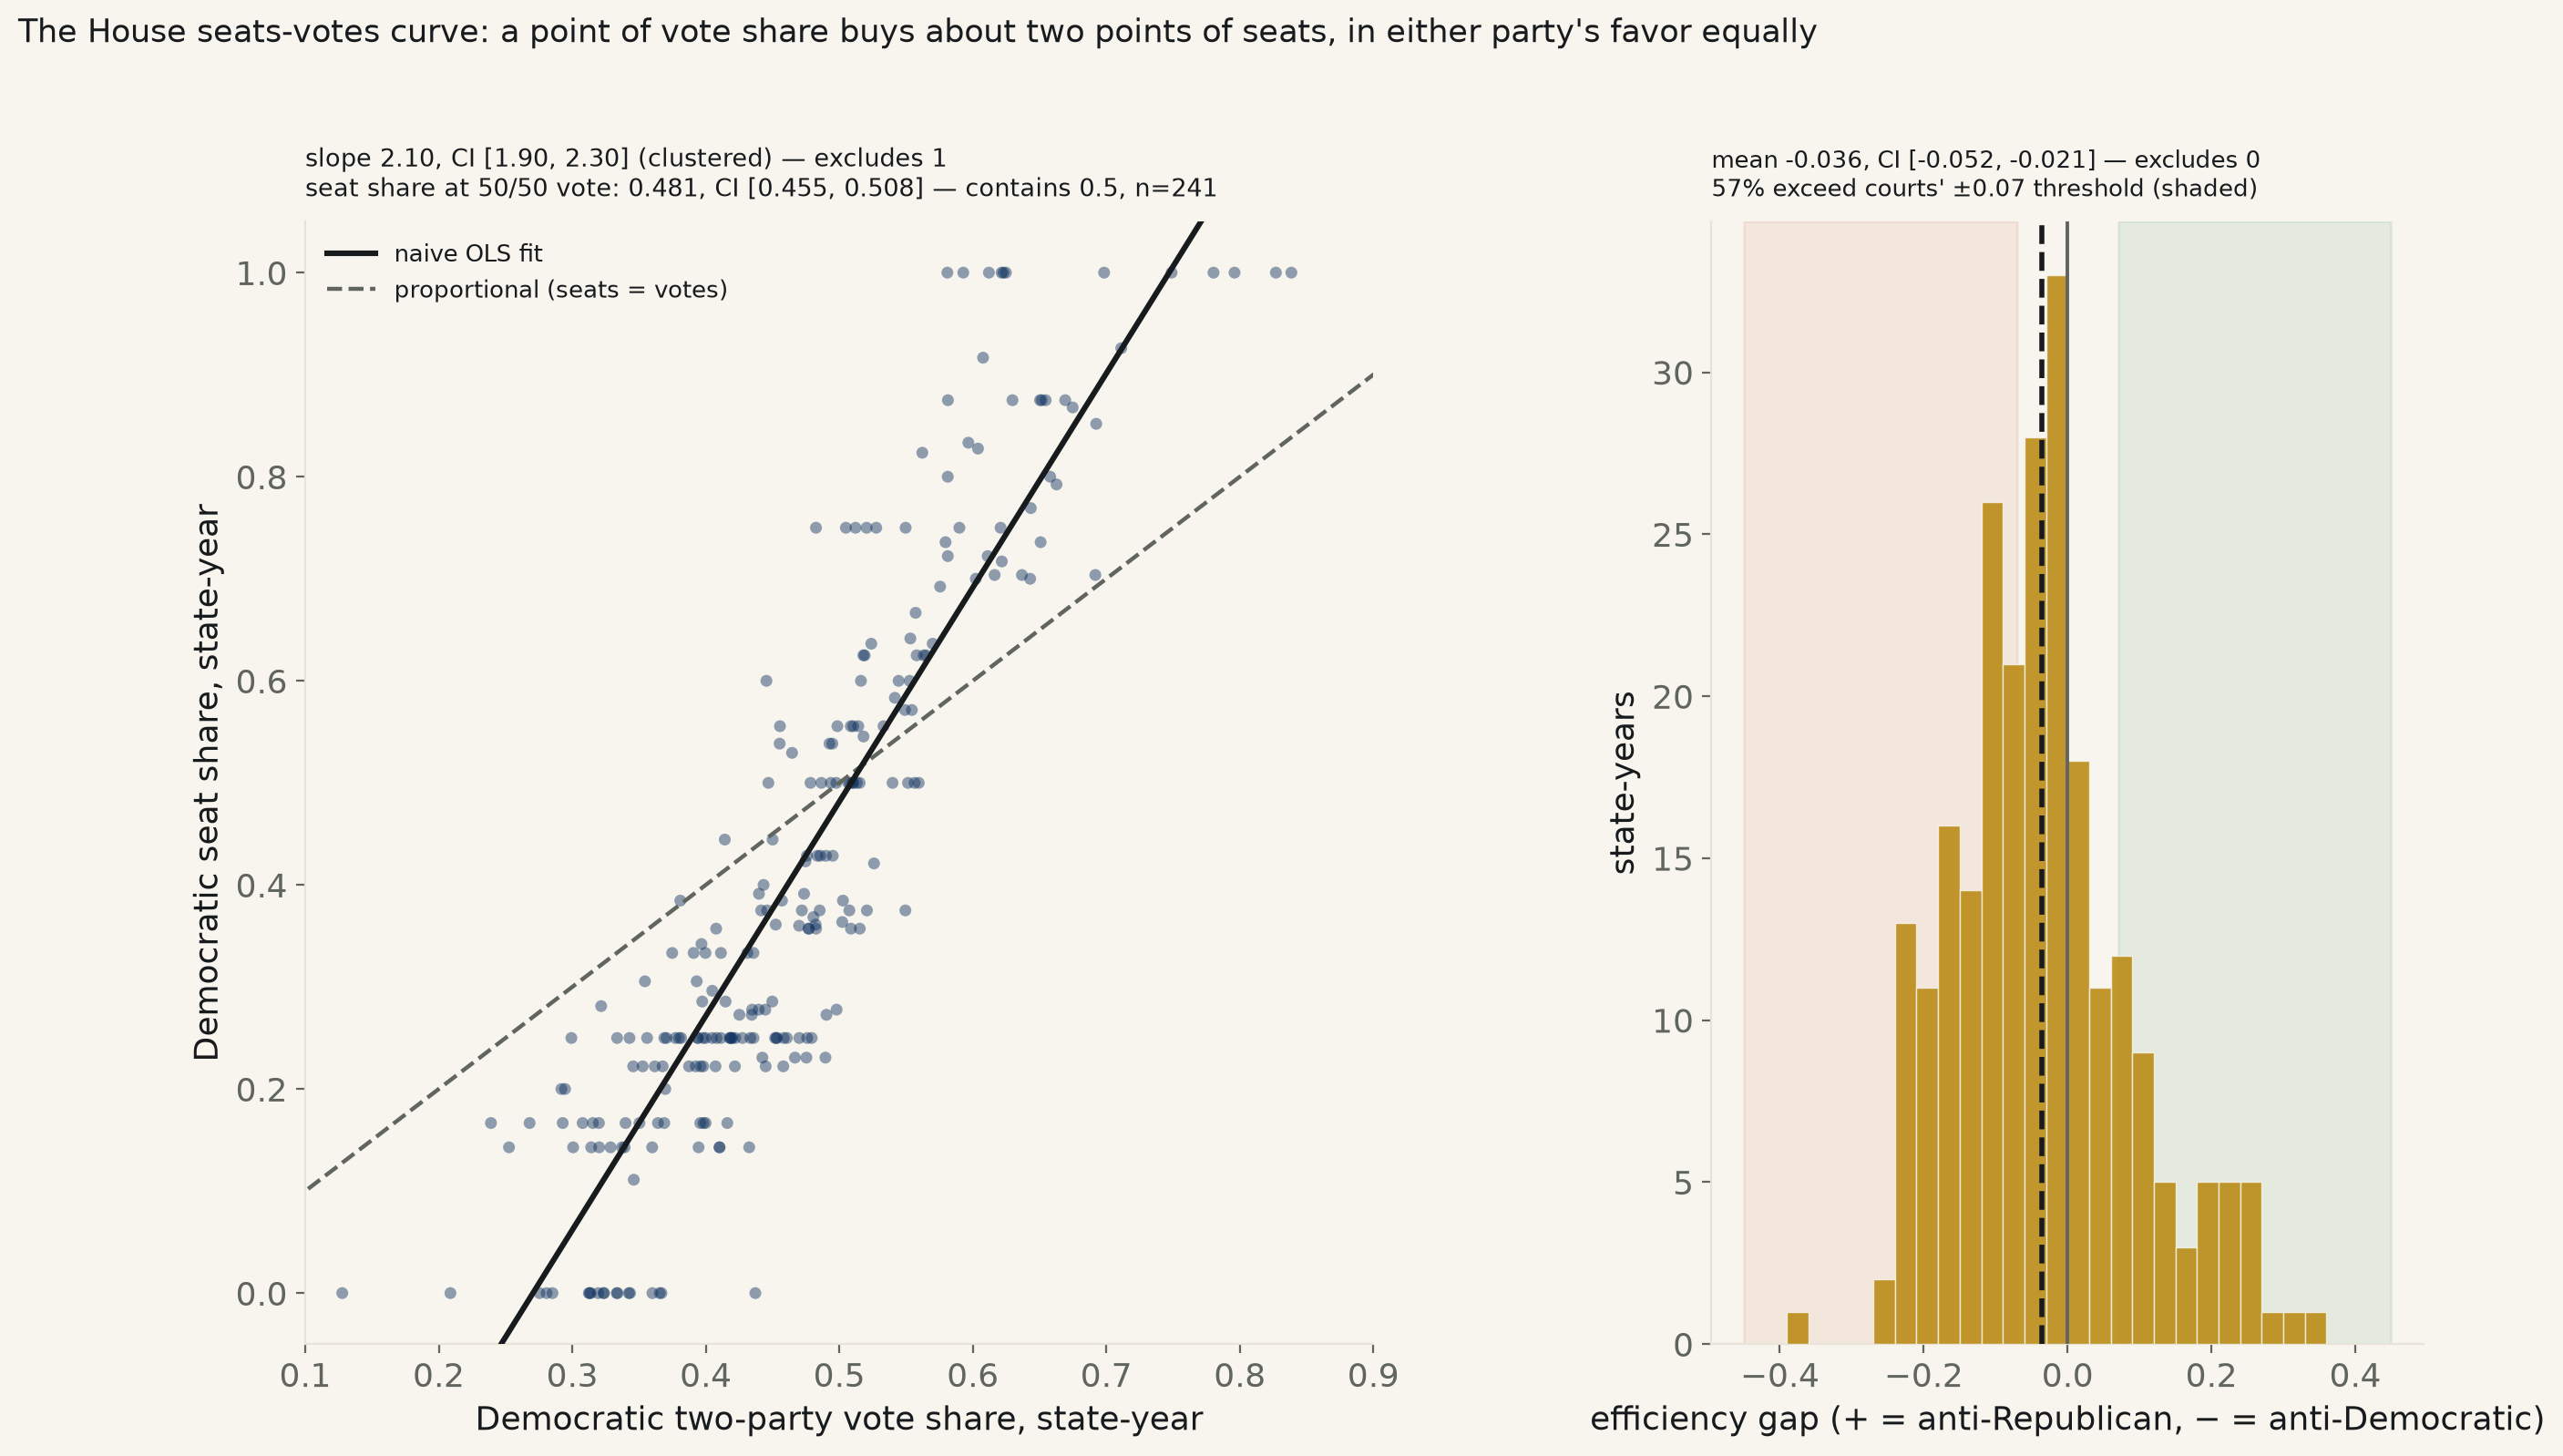
349 state-years built from every US House district with a D-vs-R race, FEC's own compiled results, 2010–2022. State-clustered OLS: Democratic seat share rises 2.099 points per point of Democratic vote share, 95% CI [1.898, 2.300] — excludes 1. But the same model's predicted seat share at a 50/50 vote split is 0.481, CI [0.455, 0.508] — contains 0.5: the amplification is real, but pooled nationally it does not reliably favor either party.
Backlog #10: “Gerrymandering & the seats-votes gap — efficiency gap vs. seat share by state.” Every US House general-election race with both a Democratic and a Republican candidate on the ballot, 2010–2022 (7 cycles; 2024's compiled results are not yet published by the FEC, the same gap run 537 hit on this exact source eight weeks ago), pulled from the FEC's own “Federal Elections” compiled results workbook — the identical source and column-matching code run 505 used for its House money-votes question, re-walked here for votes only. District races roll up to 349 state-year rows: each party's real recorded vote total in every district in that state that year (a party that fielded no candidate in a district is counted as having received zero votes there — which is what actually happened, not an imputed value), a seat counted for whichever party led in that district, and the McGhee/Stephanopoulos efficiency gap computed from the same per-district totals.
The headline fact is simple and well-replicated in the political-science literature: the conversion from votes to seats is not proportional, and it isn't close. Restricting to the 241 state-years in states with at least 4 districts (35 states; single- and few-district states have a seat share that is mechanically 0, 1, or a coarse fraction regardless of vote share, and most have no district lines to draw at all), a state-clustered OLS fit of Democratic seat share on Democratic two-party vote share returns a slope of 2.099, 95% CI [1.898, 2.300] — excludes 1 (the proportional line) by a wide margin, p=3.6e-93, R²=0.807. Plainly: a state that shifts 1 point more Democratic in its aggregate House vote typically shifts about 2.1 points more Democratic in its seat share — the swing arrives amplified, roughly doubled, for whichever party is gaining. Naive classical SE (1.968 to 2.230), HC3-robust SE (1.947 to 2.250), a district-count-weighted WLS (2.023, favoring bigger states) and a 2,000-draw cluster bootstrap that resamples whole states rather than state-years (1.913 to 2.339) all agree, and all clear 1.
But “amplified” is not the same claim as “biased toward one party,” and the two questions give different answers here. Centering the same clustered regression at a 50/50 vote split turns the intercept into the model's own prediction for a state that splits its two-party vote exactly down the middle: a Democratic seat share of 0.481, 95% CI [0.455, 0.508] — contains 0.5, p=0.171 against the null of no bias. Pooled across all 35 states and 7 cycles, the amplification itself is real and large, but which party it amplifies in any given state-year is, on average, a wash.
The efficiency gap, a different and more surgical measure of the same question, finds a small real lean. Averaged across the same 241 state-years: mean -0.036, 95% CI [-0.052, -0.021] — excludes zero, p=8.0e-06. By this script's sign convention (positive = more Republican vote wasted = map biased against Republicans), the average state-year leans slightly against Democrats — the opposite direction from a simple read of which party controls more state legislatures, and a reminder that “bias” by this metric reflects the geography of each party's own voters (Democrats cluster more tightly in cities, which wastes votes by the EG's own definition) as much as any deliberately drawn line. The pooled mean is modest — well under the courts' own commonly cited ±0.07 “extreme” threshold — but individual state-years are not: 57% of the 241 state-years individually exceed that threshold in one direction or the other, and 32% carry a positive (anti-Republican) sign versus 68% negative (anti-Democratic) — the pooled mean is a small net lean, not a universal one.
Named, for scale. CT 2010: 58.1% vote -> 100.0% seats (CT 2010: EG=+0.338). IA 2022: 43.7% vote -> 0.0% seats (IA 2022: EG=-0.374). Both are real elections under maps that were, at the time, the subject of active litigation in their respective states.
Limits, stated plainly. This is a pooled cross-decade design: a single state's seven data points sit under at least two different district maps (pre- and post-2020-census redistricting, and in several states a mid-decade court-ordered replacement map as well), and this run does not separate “which specific map” from “which state, which year” — it answers the aggregate question, not “did map X change state Y's numbers.” One cycle has a confirmed data gap: 2012 Connecticut shows only 1 of its 5 districts in the FEC's own compiled sheet (excluded by the ≥4-district threshold, so it does not reach the regression). This run also does not determine legislative intent, which court ruled which map lawful or not, or which maps were drawn by an independent commission versus a partisan legislature — the efficiency gap and the seats-votes slope are descriptive measures of what the ballots produced, not a finding of deliberate gerrymandering in any single state.
Read plainly. The House seats-votes relationship really is steep, roughly doubling a party's vote-share swing into seat-share swing, and that part of the folk claim holds up under every spec tried. The part that doesn't hold up, pooled nationally across 13 years: a reliable partisan direction to who benefits. The efficiency gap finds a real, smaller, statistically non-zero lean against Democrats on average — but it is a lean measured in single-digit percentage points of a metric whose own inventors set the “worth a court's attention” line at 7 points, not the dramatic one-sided capture the word “gerrymandering” usually conjures at the national level.
Seats-votes slope, four specifications
| Specification | n | slope (seat-share pts / vote-share pt) | 95% CI | Fit | Verdict (vs. proportional slope=1) |
|---|---|---|---|---|---|
| Naive OLS | n=241 | +2.099 | [+1.968, +2.230] | R²=0.807 | excludes 1, p=3.2e-87 |
| State-clustered SE | n=241 | +2.099 | [+1.898, +2.300] | R²=0.807 | excludes 1, p=3.6e-93 |
| HC3-robust SE | n=241 | +2.099 | [+1.947, +2.250] | R²=0.807 | excludes 1, p=4.4e-163 |
| District-count-weighted WLS | n=241 | +2.023 | [+1.909, +2.138] | R²=0.836 | excludes 1, p=1.1e-95 |
Two measures of partisan bias, pooled across all state-years
| Bias measure | n | Estimate | 95% CI | Verdict |
|---|---|---|---|---|
| Predicted Dem seat share at 50/50 vote (state-clustered) | n=241 | 0.481 | [0.455, 0.508] | contains 0.5, p=0.171 (vs. 0.5) |
| Efficiency gap, mean across state-years | n=241 | -0.036 | [-0.052, -0.021] | excludes zero, p=8.0e-06 |
Method. The FEC publishes a compiled “Federal Elections” results workbook for each House/Senate/President cycle (.xls through 2014, .xlsx after), the same source and the same sheet-finding and column-matching code run 505 used for its House money-votes analysis, walked here for vote totals only, cycles 2010 through 2022 (7 of the 8 attempted; 2024's compiled workbook returns a 404 as of this run, the identical gap run 537 documented on this exact source in September). Two row-type artifacts in the raw sheet were identified and removed before any aggregation: a pre-summed statewide “S” total row some cycles carry (confirmed by its vote totals exactly matching the sum of that state's real districts — keeping it would have both double-counted every vote and fabricated an extra “district”), and concurrent “## – UNEXPIRED TERM” special-election rows that share a ballot with a “## – FULL TERM” race for the same physical seat (the unexpired-term row is dropped; the full-term row is the ongoing two-year seat this analysis means by “district”). Non-voting territorial delegate seats (DC, PR, GU, AS, MP) are excluded — single at-large races with no state legislature drawing lines. A district where only one major party fielded a candidate keeps its real recorded vote total (zero for the absent party, which is what actually happened) rather than an imputed historical-margin value; this is a simpler and equally honest choice than the McDonald (2014) uncontested-seat convention this literature sometimes uses, but it means states with many walkover seats will show a more extreme measured vote share than a convention that imputes a competitive-but-safe margin would. The efficiency gap follows McGhee & Stephanopoulos's own definition: a losing party's entire district vote is “wasted”; a winning party's votes above the bare 50%+1 needed to win are “wasted”; summed and divided by the state-year's total two-party vote.
Limits, stated plainly. This is a pooled cross-decade design spanning at least two redistricting cycles (pre- and post-2020-census maps, plus several states' mid-decade court-ordered replacement maps) without separating which specific map produced which state-year's numbers — it answers the aggregate question across the whole window, not a map-by-map one. 2012 Connecticut returned only 1 of its 5 districts from the FEC's own sheet, a confirmed single-cycle gap excluded from the regression by the ≥4-district threshold used throughout. This run does not determine legislative intent, adjudicate which map a court found unlawful, or distinguish commission-drawn maps from legislature-drawn ones — both the seats-votes slope and the efficiency gap are descriptive measures of what the ballots produced, not a finding of deliberate gerrymandering in any single named state.
gerrymander_587.csv · gerrymander_districts_587.csv (district-level) · fit output (JSON).
| Year | State | Districts | Dem vote share | Dem seat share | Efficiency gap | In regression? |
|---|---|---|---|---|---|---|
| 2010 | AK | 1 | 30.7% | 0.0% | -0.114 | no (<4 districts) |
| 2010 | AL | 7 | 31.4% | 14.3% | +0.013 | yes |
| 2010 | AR | 4 | 42.2% | 25.0% | -0.113 | yes |
| 2010 | AZ | 8 | 44.1% | 37.5% | -0.067 | yes |
| 2010 | CA | 53 | 55.3% | 64.2% | -0.029 | yes |
| 2010 | CO | 7 | 47.6% | 42.9% | -0.068 | yes |
| 2010 | CT | 5 | 58.1% | 100.0% | +0.338 | yes |
| 2010 | DE | 1 | 58.0% | 100.0% | +0.339 | no (<4 districts) |
| 2010 | FL | 24 | 38.2% | 25.0% | -0.076 | yes |
| 2010 | GA | 13 | 38.1% | 38.5% | +0.098 | yes |
| 2010 | HI | 2 | 63.7% | 100.0% | +0.226 | no (<4 districts) |
| 2010 | IA | 5 | 44.5% | 60.0% | +0.221 | yes |
| 2010 | ID | 2 | 36.4% | 0.0% | -0.228 | no (<4 districts) |
| 2010 | IL | 19 | 52.6% | 42.1% | -0.201 | yes |
| 2010 | IN | 9 | 41.1% | 33.3% | -0.028 | yes |
| 2010 | KS | 4 | 34.2% | 0.0% | -0.185 | yes |
| 2010 | KY | 6 | 37.5% | 33.3% | +0.114 | yes |
| 2010 | LA | 6 | 31.5% | 16.7% | -0.002 | yes |
| 2010 | MA | 10 | 62.3% | 100.0% | +0.254 | yes |
| 2010 | MD | 8 | 62.1% | 75.0% | -0.026 | yes |
| 2010 | ME | 2 | 56.0% | 100.0% | +0.380 | no (<4 districts) |
| 2010 | MI | 15 | 44.3% | 40.0% | -0.017 | yes |
| 2010 | MN | 8 | 50.8% | 50.0% | -0.069 | yes |
| 2010 | MO | 9 | 39.1% | 33.3% | +0.028 | yes |
| 2010 | MS | 4 | 45.3% | 25.0% | -0.187 | yes |
| 2010 | MT | 1 | 35.9% | 0.0% | -0.218 | no (<4 districts) |
| 2010 | NC | 13 | 45.5% | 53.8% | +0.130 | yes |
| 2010 | ND | 1 | 45.1% | 0.0% | -0.402 | no (<4 districts) |
| 2010 | NE | 3 | 29.5% | 0.0% | -0.091 | no (<4 districts) |
| 2010 | NH | 2 | 46.6% | 0.0% | -0.431 | no (<4 districts) |
| 2010 | NJ | 13 | 49.3% | 53.8% | -0.014 | yes |
| 2010 | NM | 3 | 51.6% | 66.7% | +0.184 | no (<4 districts) |
| 2010 | NV | 3 | 47.1% | 33.3% | -0.201 | no (<4 districts) |
| 2010 | NY | 29 | 60.4% | 82.8% | +0.068 | yes |
| 2010 | OH | 18 | 44.0% | 27.8% | -0.125 | yes |
| 2010 | OK | 4 | 29.9% | 25.0% | +0.159 | yes |
| 2010 | OR | 4 | 59.0% | 75.0% | +0.032 | yes |
| 2010 | PA | 19 | 48.1% | 36.8% | -0.110 | yes |
| 2010 | RI | 2 | 59.4% | 100.0% | +0.312 | no (<4 districts) |
| 2010 | SC | 6 | 41.6% | 16.7% | -0.179 | yes |
| 2010 | SD | 1 | 48.8% | 0.0% | -0.476 | no (<4 districts) |
| 2010 | TN | 9 | 36.2% | 22.2% | -0.018 | yes |
| 2010 | TX | 32 | 32.2% | 28.1% | +0.069 | yes |
| 2010 | UT | 3 | 35.8% | 33.3% | +0.183 | no (<4 districts) |
| 2010 | VA | 11 | 43.4% | 27.3% | -0.097 | yes |
| 2010 | VT | 1 | 66.8% | 100.0% | +0.163 | no (<4 districts) |
| 2010 | WA | 9 | 53.3% | 55.6% | -0.022 | yes |
| 2010 | WI | 8 | 44.6% | 37.5% | -0.032 | yes |
| 2010 | WV | 3 | 44.6% | 33.3% | -0.100 | no (<4 districts) |
| 2010 | WY | 1 | 25.8% | 0.0% | -0.016 | no (<4 districts) |
| 2012 | AK | 1 | 30.9% | 0.0% | -0.118 | no (<4 districts) |
| 2012 | AL | 7 | 36.0% | 14.3% | -0.061 | yes |
| 2012 | AR | 4 | 32.3% | 0.0% | -0.147 | yes |
| 2012 | AZ | 9 | 45.6% | 55.6% | +0.083 | yes |
| 2012 | CA | 53 | 62.2% | 71.7% | -0.036 | yes |
| 2012 | CO | 7 | 48.6% | 42.9% | +0.000 | yes |
| 2012 | CT | 1 | 100.0% | 100.0% | -0.500 | no (<4 districts) |
| 2012 | DE | 1 | 65.8% | 100.0% | +0.183 | no (<4 districts) |
| 2012 | FL | 25 | 47.0% | 36.0% | -0.107 | yes |
| 2012 | GA | 14 | 40.8% | 35.7% | +0.066 | yes |
| 2012 | HI | 2 | 67.5% | 100.0% | +0.151 | no (<4 districts) |
| 2012 | IA | 4 | 51.5% | 50.0% | -0.024 | yes |
| 2012 | ID | 2 | 33.9% | 0.0% | -0.177 | no (<4 districts) |
| 2012 | IL | 18 | 55.7% | 66.7% | +0.015 | yes |
| 2012 | IN | 9 | 45.8% | 22.2% | -0.201 | yes |
| 2012 | KS | 4 | 20.9% | 0.0% | +0.082 | yes |
| 2012 | KY | 6 | 40.0% | 16.7% | -0.114 | yes |
| 2012 | LA | 6 | 23.9% | 16.7% | +0.209 | yes |
| 2012 | MA | 9 | 74.9% | 100.0% | +0.002 | yes |
| 2012 | MD | 8 | 65.5% | 87.5% | +0.067 | yes |
| 2012 | ME | 2 | 61.7% | 100.0% | +0.267 | no (<4 districts) |
| 2012 | MI | 14 | 51.5% | 35.7% | -0.171 | yes |
| 2012 | MN | 8 | 56.3% | 62.5% | -0.021 | yes |
| 2012 | MO | 8 | 43.3% | 25.0% | -0.115 | yes |
| 2012 | MS | 4 | 36.9% | 25.0% | +0.044 | yes |
| 2012 | MT | 1 | 44.5% | 0.0% | -0.390 | no (<4 districts) |
| 2012 | NC | 13 | 47.5% | 23.1% | -0.233 | yes |
| 2012 | ND | 1 | 43.2% | 0.0% | -0.364 | no (<4 districts) |
| 2012 | NE | 3 | 35.8% | 0.0% | -0.215 | no (<4 districts) |
| 2012 | NH | 2 | 52.2% | 100.0% | +0.455 | no (<4 districts) |
| 2012 | NJ | 12 | 55.6% | 50.0% | -0.174 | yes |
| 2012 | NM | 3 | 56.6% | 66.7% | +0.092 | no (<4 districts) |
| 2012 | NV | 4 | 49.8% | 50.0% | -0.065 | yes |
| 2012 | NY | 27 | 69.2% | 85.2% | -0.045 | yes |
| 2012 | OH | 16 | 47.9% | 25.0% | -0.231 | yes |
| 2012 | OK | 5 | 32.4% | 0.0% | -0.148 | yes |
| 2012 | OR | 4 | 44.7% | 50.0% | +0.265 | yes |
| 2012 | PA | 18 | 49.8% | 27.8% | -0.213 | yes |
| 2012 | RI | 2 | 59.0% | 100.0% | +0.321 | no (<4 districts) |
| 2012 | SC | 7 | 41.0% | 14.3% | -0.195 | yes |
| 2012 | SD | 1 | 42.6% | 0.0% | -0.351 | no (<4 districts) |
| 2012 | TN | 9 | 36.8% | 22.2% | -0.002 | yes |
| 2012 | TX | 36 | 40.0% | 33.3% | -0.041 | yes |
| 2012 | UT | 4 | 33.4% | 25.0% | +0.078 | yes |
| 2012 | VA | 11 | 49.0% | 27.3% | -0.217 | yes |
| 2012 | VT | 1 | 0.0% | 0.0% | +0.500 | no (<4 districts) |
| 2012 | WA | 10 | 54.4% | 60.0% | +0.033 | yes |
| 2012 | WI | 8 | 50.8% | 37.5% | -0.148 | yes |
| 2012 | WV | 3 | 40.1% | 33.3% | +0.011 | no (<4 districts) |
| 2012 | WY | 1 | 25.7% | 0.0% | -0.014 | no (<4 districts) |
| 2014 | AK | 1 | 44.6% | 0.0% | -0.391 | no (<4 districts) |
| 2014 | AL | 7 | 32.0% | 14.3% | -0.011 | yes |
| 2014 | AR | 4 | 33.3% | 0.0% | -0.167 | yes |
| 2014 | AZ | 9 | 41.4% | 44.4% | +0.030 | yes |
| 2014 | CA | 53 | 58.0% | 73.6% | +0.051 | yes |
| 2014 | CO | 7 | 48.4% | 42.9% | -0.013 | yes |
| 2014 | CT | 5 | 59.3% | 100.0% | +0.314 | yes |
| 2014 | DE | 1 | 61.7% | 100.0% | +0.266 | no (<4 districts) |
| 2014 | FL | 23 | 44.0% | 39.1% | -0.033 | yes |
| 2014 | GA | 14 | 41.5% | 28.6% | -0.046 | yes |
| 2014 | HI | 2 | 66.2% | 100.0% | +0.176 | no (<4 districts) |
| 2014 | IA | 4 | 46.1% | 25.0% | -0.175 | yes |
| 2014 | ID | 2 | 36.8% | 0.0% | -0.236 | no (<4 districts) |
| 2014 | IL | 18 | 51.4% | 55.6% | -0.020 | yes |
| 2014 | IN | 9 | 38.7% | 22.2% | -0.085 | yes |
| 2014 | KS | 4 | 36.6% | 0.0% | -0.231 | yes |
| 2014 | KY | 6 | 36.4% | 16.7% | -0.053 | yes |
| 2014 | LA | 6 | 30.8% | 16.7% | +0.033 | yes |
| 2014 | MA | 9 | 82.7% | 100.0% | -0.154 | yes |
| 2014 | MD | 8 | 58.1% | 87.5% | +0.189 | yes |
| 2014 | ME | 2 | 57.2% | 50.0% | -0.117 | no (<4 districts) |
| 2014 | MI | 14 | 50.9% | 35.7% | -0.182 | yes |
| 2014 | MN | 8 | 51.9% | 62.5% | +0.079 | yes |
| 2014 | MO | 8 | 38.0% | 25.0% | -0.036 | yes |
| 2014 | MS | 4 | 41.1% | 25.0% | -0.143 | yes |
| 2014 | MT | 1 | 42.2% | 0.0% | -0.343 | no (<4 districts) |
| 2014 | NC | 13 | 44.2% | 23.1% | -0.166 | yes |
| 2014 | ND | 1 | 40.9% | 0.0% | -0.319 | no (<4 districts) |
| 2014 | NE | 3 | 35.2% | 33.3% | +0.104 | no (<4 districts) |
| 2014 | NH | 2 | 51.6% | 50.0% | -0.036 | no (<4 districts) |
| 2014 | NJ | 12 | 51.0% | 50.0% | -0.115 | yes |
| 2014 | NM | 3 | 53.0% | 66.7% | +0.151 | no (<4 districts) |
| 2014 | NV | 4 | 40.8% | 25.0% | -0.168 | yes |
| 2014 | NY | 27 | 61.6% | 70.4% | -0.121 | yes |
| 2014 | OH | 16 | 40.0% | 25.0% | -0.079 | yes |
| 2014 | OK | 4 | 27.6% | 0.0% | -0.051 | yes |
| 2014 | OR | 3 | 58.3% | 66.7% | -0.034 | no (<4 districts) |
| 2014 | PA | 18 | 44.5% | 27.8% | -0.128 | yes |
| 2014 | RI | 2 | 61.1% | 100.0% | +0.278 | no (<4 districts) |
| 2014 | SC | 7 | 33.9% | 14.3% | -0.025 | yes |
| 2014 | SD | 1 | 33.5% | 0.0% | -0.169 | no (<4 districts) |
| 2014 | TN | 9 | 34.6% | 22.2% | +0.014 | yes |
| 2014 | TX | 36 | 35.4% | 30.6% | -0.013 | yes |
| 2014 | UT | 4 | 34.3% | 0.0% | -0.187 | yes |
| 2014 | VA | 11 | 42.5% | 27.3% | -0.092 | yes |
| 2014 | VT | 1 | 67.5% | 100.0% | +0.150 | no (<4 districts) |
| 2014 | WA | 10 | 51.6% | 60.0% | +0.084 | yes |
| 2014 | WI | 8 | 47.2% | 37.5% | -0.080 | yes |
| 2014 | WV | 3 | 42.9% | 0.0% | -0.358 | no (<4 districts) |
| 2014 | WY | 1 | 25.1% | 0.0% | -0.001 | no (<4 districts) |
| 2016 | AK | 1 | 41.7% | 0.0% | -0.334 | no (<4 districts) |
| 2016 | AL | 7 | 33.7% | 14.3% | -0.050 | yes |
| 2016 | AR | 4 | 12.8% | 0.0% | +0.245 | yes |
| 2016 | AZ | 9 | 45.0% | 44.4% | -0.031 | yes |
| 2016 | CA | 53 | 65.1% | 73.6% | -0.083 | yes |
| 2016 | CO | 7 | 49.5% | 42.9% | -0.045 | yes |
| 2016 | CT | 5 | 62.2% | 100.0% | +0.257 | yes |
| 2016 | DE | 1 | 57.5% | 100.0% | +0.349 | no (<4 districts) |
| 2016 | FL | 26 | 45.7% | 38.5% | -0.043 | yes |
| 2016 | GA | 14 | 39.7% | 28.6% | -0.007 | yes |
| 2016 | HI | 2 | 78.7% | 100.0% | -0.074 | no (<4 districts) |
| 2016 | IA | 4 | 45.3% | 25.0% | -0.158 | yes |
| 2016 | ID | 2 | 31.8% | 0.0% | -0.137 | no (<4 districts) |
| 2016 | IL | 18 | 51.1% | 55.6% | -0.025 | yes |
| 2016 | IN | 9 | 42.2% | 22.2% | -0.159 | yes |
| 2016 | KS | 4 | 31.4% | 0.0% | -0.128 | yes |
| 2016 | KY | 6 | 29.3% | 16.7% | +0.104 | yes |
| 2016 | LA | 6 | 32.0% | 16.7% | +0.021 | yes |
| 2016 | MA | 9 | 83.9% | 100.0% | -0.177 | yes |
| 2016 | MD | 8 | 63.0% | 87.5% | +0.107 | yes |
| 2016 | ME | 2 | 52.0% | 50.0% | -0.012 | no (<4 districts) |
| 2016 | MI | 14 | 48.3% | 35.7% | -0.123 | yes |
| 2016 | MN | 8 | 51.8% | 62.5% | +0.070 | yes |
| 2016 | MO | 8 | 39.4% | 25.0% | -0.056 | yes |
| 2016 | MS | 4 | 39.8% | 25.0% | -0.052 | yes |
| 2016 | MT | 1 | 41.9% | 0.0% | -0.338 | no (<4 districts) |
| 2016 | NC | 13 | 46.7% | 23.1% | -0.194 | yes |
| 2016 | ND | 1 | 25.6% | 0.0% | -0.011 | no (<4 districts) |
| 2016 | NE | 3 | 28.4% | 0.0% | -0.068 | no (<4 districts) |
| 2016 | NH | 2 | 51.6% | 100.0% | +0.469 | no (<4 districts) |
| 2016 | NJ | 12 | 54.2% | 58.3% | -0.056 | yes |
| 2016 | NM | 3 | 56.0% | 66.7% | +0.086 | no (<4 districts) |
| 2016 | NV | 4 | 50.5% | 75.0% | +0.193 | yes |
| 2016 | NY | 27 | 69.2% | 70.4% | -0.211 | yes |
| 2016 | OH | 16 | 41.8% | 25.0% | -0.107 | yes |
| 2016 | OK | 4 | 28.1% | 0.0% | -0.062 | yes |
| 2016 | OR | 4 | 56.0% | 50.0% | -0.060 | yes |
| 2016 | PA | 18 | 43.5% | 27.8% | -0.098 | yes |
| 2016 | RI | 2 | 65.1% | 100.0% | +0.198 | no (<4 districts) |
| 2016 | SC | 7 | 39.5% | 14.3% | -0.163 | yes |
| 2016 | SD | 1 | 35.9% | 0.0% | -0.218 | no (<4 districts) |
| 2016 | TN | 9 | 35.3% | 22.2% | +0.005 | yes |
| 2016 | TX | 36 | 39.3% | 30.6% | -0.056 | yes |
| 2016 | UT | 4 | 33.4% | 0.0% | -0.168 | yes |
| 2016 | VA | 11 | 50.2% | 36.4% | -0.167 | yes |
| 2016 | WA | 10 | 55.3% | 60.0% | +0.016 | yes |
| 2016 | WI | 8 | 52.1% | 37.5% | -0.211 | yes |
| 2016 | WV | 3 | 33.5% | 0.0% | -0.171 | no (<4 districts) |
| 2016 | WY | 1 | 32.6% | 0.0% | -0.152 | no (<4 districts) |
| 2018 | AK | 1 | 0.0% | 0.0% | +0.500 | no (<4 districts) |
| 2018 | AL | 7 | 41.0% | 14.3% | -0.209 | yes |
| 2018 | AR | 4 | 36.0% | 0.0% | -0.220 | yes |
| 2018 | AZ | 9 | 50.9% | 55.6% | -0.037 | yes |
| 2018 | CA | 53 | 67.5% | 86.8% | +0.005 | yes |
| 2018 | CO | 7 | 55.4% | 57.1% | -0.021 | yes |
| 2018 | CT | 5 | 61.2% | 100.0% | +0.276 | yes |
| 2018 | DE | 1 | 64.5% | 100.0% | +0.211 | no (<4 districts) |
| 2018 | FL | 23 | 47.4% | 39.1% | -0.097 | yes |
| 2018 | GA | 14 | 47.7% | 35.7% | -0.085 | yes |
| 2018 | HI | 2 | 76.7% | 100.0% | -0.034 | no (<4 districts) |
| 2018 | IA | 4 | 52.0% | 75.0% | +0.220 | yes |
| 2018 | ID | 2 | 36.0% | 0.0% | -0.221 | no (<4 districts) |
| 2018 | IL | 18 | 61.1% | 72.2% | -0.017 | yes |
| 2018 | IN | 9 | 44.5% | 22.2% | -0.184 | yes |
| 2018 | KS | 4 | 45.2% | 25.0% | -0.102 | yes |
| 2018 | KY | 6 | 39.6% | 16.7% | -0.114 | yes |
| 2018 | LA | 6 | 39.8% | 16.7% | -0.160 | yes |
| 2018 | MA | 9 | 79.6% | 100.0% | -0.092 | yes |
| 2018 | MD | 8 | 66.9% | 87.5% | +0.027 | yes |
| 2018 | ME | 2 | 57.6% | 50.0% | -0.112 | no (<4 districts) |
| 2018 | MI | 14 | 54.0% | 50.0% | -0.098 | yes |
| 2018 | MN | 8 | 55.8% | 62.5% | +0.028 | yes |
| 2018 | MO | 8 | 43.6% | 25.0% | -0.142 | yes |
| 2018 | MS | 4 | 45.8% | 25.0% | -0.234 | yes |
| 2018 | MT | 1 | 47.6% | 0.0% | -0.452 | no (<4 districts) |
| 2018 | NC | 13 | 49.0% | 23.1% | -0.236 | yes |
| 2018 | ND | 1 | 37.1% | 0.0% | -0.243 | no (<4 districts) |
| 2018 | NE | 3 | 38.0% | 0.0% | -0.259 | no (<4 districts) |
| 2018 | NH | 2 | 55.6% | 100.0% | +0.389 | no (<4 districts) |
| 2018 | NJ | 12 | 60.8% | 91.7% | +0.190 | yes |
| 2018 | NM | 3 | 60.4% | 100.0% | +0.292 | no (<4 districts) |
| 2018 | NV | 4 | 52.8% | 75.0% | +0.136 | yes |
| 2018 | NY | 27 | 71.1% | 92.6% | -0.003 | yes |
| 2018 | OH | 16 | 47.6% | 25.0% | -0.228 | yes |
| 2018 | OK | 5 | 37.0% | 20.0% | -0.033 | yes |
| 2018 | OR | 4 | 37.1% | 25.0% | +0.129 | yes |
| 2018 | PA | 18 | 55.1% | 50.0% | -0.093 | yes |
| 2018 | RI | 2 | 65.1% | 100.0% | +0.197 | no (<4 districts) |
| 2018 | SC | 7 | 45.0% | 28.6% | -0.109 | yes |
| 2018 | SD | 1 | 37.4% | 0.0% | -0.248 | no (<4 districts) |
| 2018 | TN | 9 | 39.8% | 22.2% | -0.088 | yes |
| 2018 | TX | 36 | 48.2% | 36.1% | -0.195 | yes |
| 2018 | UT | 4 | 37.7% | 25.0% | +0.017 | yes |
| 2018 | VA | 11 | 57.0% | 63.6% | +0.003 | yes |
| 2018 | VT | 1 | 72.7% | 100.0% | +0.045 | no (<4 districts) |
| 2018 | WA | 10 | 64.3% | 70.0% | -0.076 | yes |
| 2018 | WI | 8 | 55.0% | 37.5% | -0.262 | yes |
| 2018 | WV | 3 | 41.0% | 0.0% | -0.321 | no (<4 districts) |
| 2018 | WY | 1 | 31.9% | 0.0% | -0.138 | no (<4 districts) |
| 2020 | AK | 1 | 0.0% | 0.0% | +0.500 | no (<4 districts) |
| 2020 | AL | 7 | 30.1% | 14.3% | +0.010 | yes |
| 2020 | AR | 4 | 28.5% | 0.0% | -0.070 | yes |
| 2020 | AZ | 9 | 49.9% | 55.6% | -0.012 | yes |
| 2020 | CA | 53 | 66.3% | 79.2% | -0.046 | yes |
| 2020 | CO | 7 | 54.9% | 57.1% | -0.019 | yes |
| 2020 | CT | 5 | 65.8% | 80.0% | +0.071 | yes |
| 2020 | DE | 1 | 58.9% | 100.0% | +0.322 | no (<4 districts) |
| 2020 | FL | 26 | 47.5% | 42.3% | -0.056 | yes |
| 2020 | GA | 14 | 49.0% | 42.9% | -0.049 | yes |
| 2020 | HI | 2 | 69.6% | 100.0% | +0.109 | no (<4 districts) |
| 2020 | IA | 4 | 47.0% | 25.0% | -0.174 | yes |
| 2020 | ID | 2 | 31.3% | 0.0% | -0.126 | no (<4 districts) |
| 2020 | IL | 18 | 58.1% | 72.2% | +0.043 | yes |
| 2020 | IN | 9 | 40.7% | 22.2% | -0.110 | yes |
| 2020 | KS | 4 | 41.8% | 25.0% | -0.037 | yes |
| 2020 | KY | 6 | 35.0% | 16.7% | -0.025 | yes |
| 2020 | LA | 6 | 36.9% | 16.7% | -0.086 | yes |
| 2020 | MA | 9 | 78.0% | 100.0% | -0.061 | yes |
| 2020 | MD | 8 | 65.0% | 87.5% | +0.065 | yes |
| 2020 | ME | 2 | 74.0% | 100.0% | +0.021 | no (<4 districts) |
| 2020 | MI | 14 | 50.7% | 50.0% | -0.028 | yes |
| 2020 | MN | 8 | 51.3% | 50.0% | -0.011 | yes |
| 2020 | MO | 8 | 40.5% | 25.0% | -0.084 | yes |
| 2020 | MS | 4 | 34.3% | 25.0% | +0.056 | yes |
| 2020 | MT | 1 | 43.6% | 0.0% | -0.372 | no (<4 districts) |
| 2020 | NC | 13 | 50.3% | 38.5% | -0.113 | yes |
| 2020 | ND | 1 | 28.6% | 0.0% | -0.071 | no (<4 districts) |
| 2020 | NE | 3 | 35.8% | 0.0% | -0.216 | no (<4 districts) |
| 2020 | NH | 2 | 53.9% | 100.0% | +0.422 | no (<4 districts) |
| 2020 | NJ | 12 | 59.7% | 83.3% | +0.122 | yes |
| 2020 | NM | 3 | 54.9% | 66.7% | +0.110 | no (<4 districts) |
| 2020 | NV | 4 | 51.2% | 75.0% | +0.189 | yes |
| 2020 | NY | 27 | 63.7% | 70.4% | -0.098 | yes |
| 2020 | OH | 16 | 42.0% | 25.0% | -0.117 | yes |
| 2020 | OK | 5 | 31.3% | 0.0% | -0.126 | yes |
| 2020 | OR | 5 | 29.5% | 20.0% | +0.231 | yes |
| 2020 | PA | 18 | 49.4% | 50.0% | +0.019 | yes |
| 2020 | RI | 2 | 74.0% | 100.0% | +0.020 | no (<4 districts) |
| 2020 | SC | 7 | 43.3% | 14.3% | -0.250 | yes |
| 2020 | SD | 1 | 0.0% | 0.0% | +0.500 | no (<4 districts) |
| 2020 | TN | 9 | 39.6% | 22.2% | -0.117 | yes |
| 2020 | TX | 36 | 45.2% | 36.1% | -0.121 | yes |
| 2020 | UT | 4 | 36.7% | 0.0% | -0.234 | yes |
| 2020 | VA | 11 | 52.4% | 63.6% | +0.103 | yes |
| 2020 | VT | 1 | 71.4% | 100.0% | +0.073 | no (<4 districts) |
| 2020 | WA | 10 | 60.2% | 70.0% | +0.006 | yes |
| 2020 | WI | 8 | 48.5% | 37.5% | -0.115 | yes |
| 2020 | WV | 3 | 32.4% | 0.0% | -0.149 | no (<4 districts) |
| 2020 | WY | 1 | 26.4% | 0.0% | -0.028 | no (<4 districts) |
| 2022 | AK | 1 | 49.8% | 0.0% | -0.497 | no (<4 districts) |
| 2022 | AL | 7 | 25.3% | 14.3% | +0.146 | yes |
| 2022 | AR | 4 | 31.2% | 0.0% | -0.125 | yes |
| 2022 | AZ | 9 | 43.1% | 33.3% | -0.104 | yes |
| 2022 | CA | 52 | 64.3% | 76.9% | -0.041 | yes |
| 2022 | CO | 8 | 56.5% | 62.5% | -0.019 | yes |
| 2022 | CT | 5 | 62.5% | 100.0% | +0.250 | yes |
| 2022 | DE | 1 | 56.4% | 100.0% | +0.373 | no (<4 districts) |
| 2022 | FL | 27 | 40.5% | 29.6% | -0.056 | yes |
| 2022 | GA | 14 | 47.7% | 35.7% | -0.118 | yes |
| 2022 | HI | 2 | 68.7% | 100.0% | +0.127 | no (<4 districts) |
| 2022 | IA | 4 | 43.7% | 0.0% | -0.374 | yes |
| 2022 | ID | 2 | 31.4% | 0.0% | -0.128 | no (<4 districts) |
| 2022 | IL | 17 | 56.2% | 82.4% | +0.156 | yes |
| 2022 | IN | 9 | 39.3% | 22.2% | -0.075 | yes |
| 2022 | KS | 4 | 42.8% | 25.0% | -0.059 | yes |
| 2022 | KY | 6 | 34.0% | 16.7% | -0.000 | yes |
| 2022 | LA | 5 | 29.2% | 20.0% | +0.104 | yes |
| 2022 | MA | 9 | 69.8% | 100.0% | +0.103 | yes |
| 2022 | MD | 8 | 65.2% | 87.5% | +0.052 | yes |
| 2022 | ME | 2 | 58.0% | 100.0% | +0.341 | no (<4 districts) |
| 2022 | MI | 13 | 49.5% | 53.8% | +0.054 | yes |
| 2022 | MN | 8 | 51.0% | 50.0% | -0.019 | yes |
| 2022 | MO | 8 | 39.4% | 25.0% | -0.070 | yes |
| 2022 | MS | 4 | 35.6% | 25.0% | +0.043 | yes |
| 2022 | MT | 2 | 39.3% | 0.0% | -0.286 | no (<4 districts) |
| 2022 | NC | 14 | 47.8% | 50.0% | +0.039 | yes |
| 2022 | ND | 1 | 0.0% | 0.0% | +0.500 | no (<4 districts) |
| 2022 | NE | 3 | 36.2% | 0.0% | -0.225 | no (<4 districts) |
| 2022 | NH | 2 | 55.0% | 100.0% | +0.401 | no (<4 districts) |
| 2022 | NJ | 12 | 55.0% | 75.0% | +0.091 | yes |
| 2022 | NM | 3 | 55.1% | 100.0% | +0.399 | no (<4 districts) |
| 2022 | NV | 4 | 48.3% | 75.0% | +0.231 | yes |
| 2022 | NY | 26 | 57.6% | 69.2% | -0.028 | yes |
| 2022 | OH | 15 | 43.6% | 33.3% | -0.050 | yes |
| 2022 | OK | 5 | 31.9% | 0.0% | -0.139 | yes |
| 2022 | OR | 6 | 26.8% | 16.7% | +0.215 | yes |
| 2022 | PA | 17 | 46.5% | 52.9% | +0.110 | yes |
| 2022 | RI | 2 | 57.4% | 100.0% | +0.353 | no (<4 districts) |
| 2022 | SC | 7 | 32.9% | 14.3% | -0.023 | yes |
| 2022 | SD | 1 | 0.0% | 0.0% | +0.500 | no (<4 districts) |
| 2022 | TN | 9 | 34.6% | 11.1% | -0.116 | yes |
| 2022 | TX | 38 | 39.7% | 34.2% | -0.011 | yes |
| 2022 | UT | 4 | 48.7% | 50.0% | -0.231 | yes |
| 2022 | VA | 11 | 51.8% | 54.5% | -0.017 | yes |
| 2022 | VT | 1 | 69.2% | 100.0% | +0.115 | no (<4 districts) |
| 2022 | WA | 10 | 58.1% | 80.0% | +0.159 | yes |
| 2022 | WI | 8 | 41.9% | 25.0% | -0.082 | yes |
| 2022 | WV | 2 | 32.4% | 0.0% | -0.148 | no (<4 districts) |
| 2022 | WY | 1 | 26.3% | 0.0% | -0.027 | no (<4 districts) |