318 NBA players, 2025-26 season, Basketball-Reference's own per-game stats joined to each player's current salary. Personal fouls per 36 minutes fall -0.234 per log-salary point (95% CI [-0.314, -0.154]) — excludes zero. Free throw attempts per 36 minutes rise +1.002 (CI [+0.807, +1.196]) — excludes zero. Both survive controlling for shot volume and position.
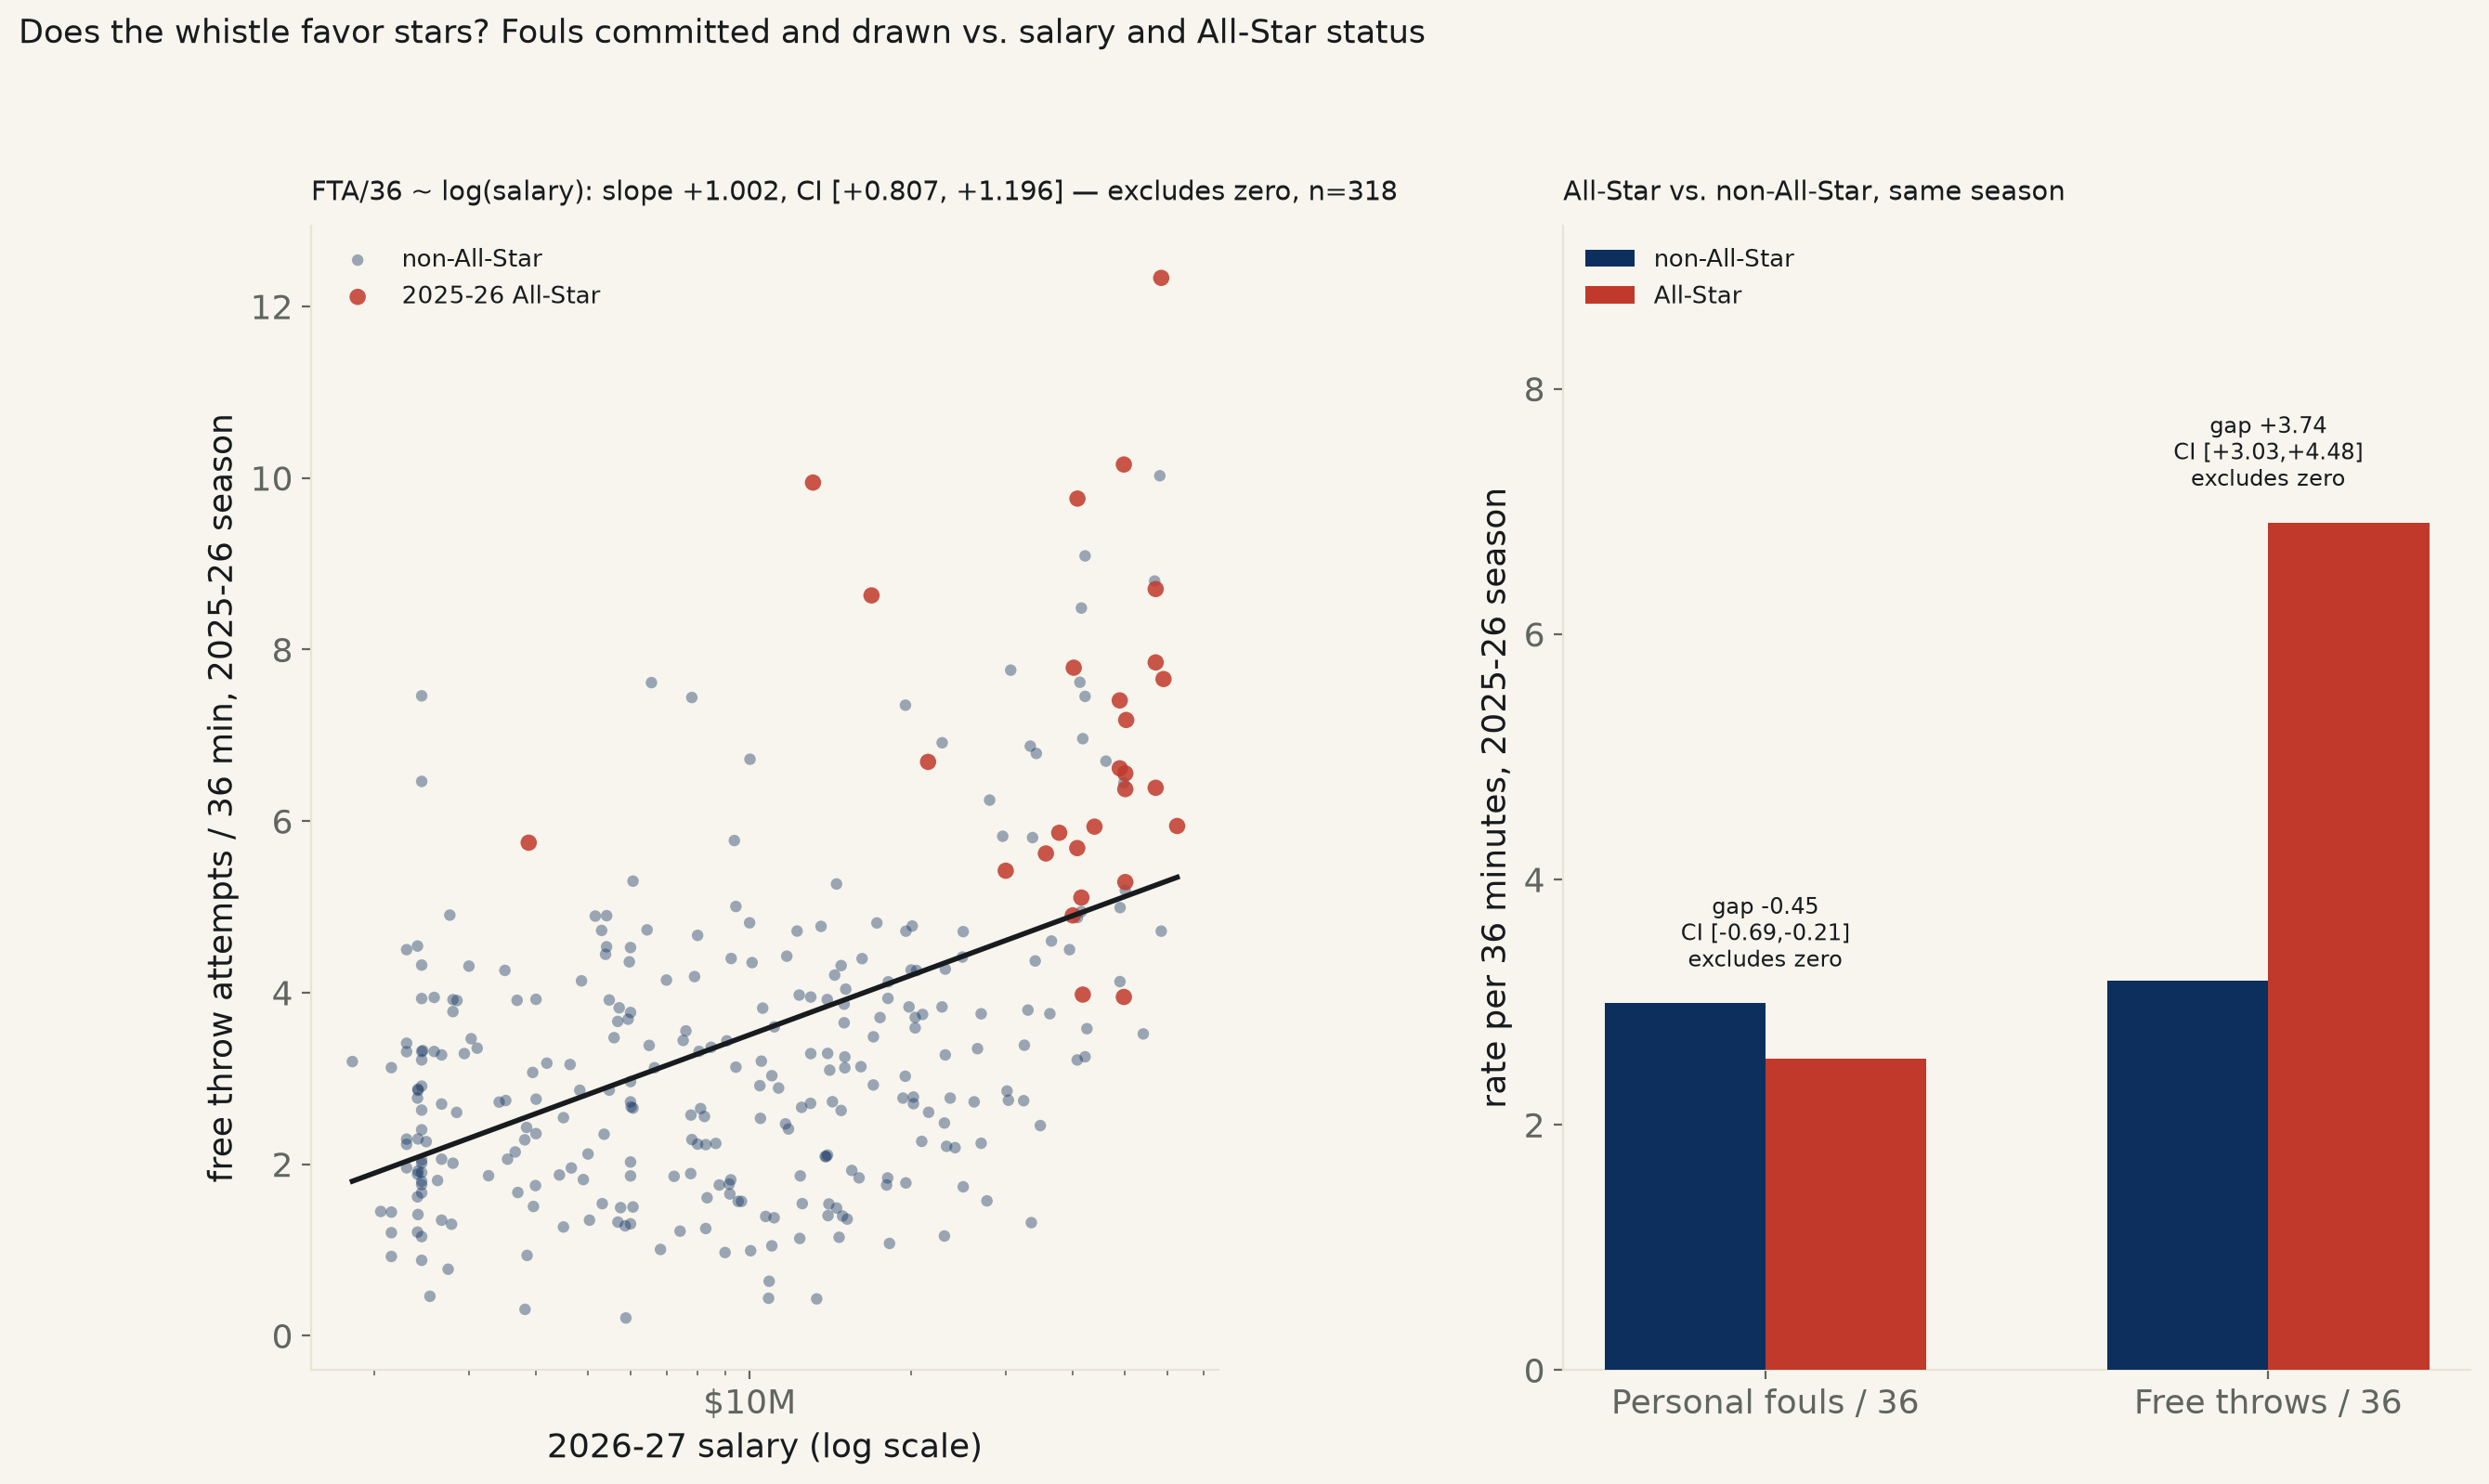
Backlog idea #49 ("Do refs favor stars? Foul calls vs player fame/salary — [real bias]"), previously untouched. Basketball-Reference's own 2025-26 NBA season per-game box score stats (the most recently completed season as of this run — 2026-27 is only a few weeks old, too thin for stable per-36-minute rates) joined to each player's current, already-signed 2026-27 salary from Basketball-Reference's own contracts page — the best available single-row, keyless proxy for how much the market values and knows a player. 318 players clear a reliable-rate floor (G≥20, at least 15 minutes per game); traded players' per-team splits were collapsed to Basketball-Reference's own combined-team row so nobody is double-counted.
Both ends of the claim hold, and the direction is the one the backlog's own tag predicted. Personal fouls committed per 36 minutes fall as salary rises: -0.234 fewer fouls per log-salary point, 95% CI [-0.314, -0.154] — excludes zero, R²=0.094, p=2.3e-08. Free throw attempts per 36 minutes rise: +1.002 more per log-salary point, CI [+0.807, +1.196] — excludes zero, R²=0.246, p=4.1e-21. Higher-salary players get fewer fouls called on them on defense and more fouls called for them on offense — both directions a "star treatment" story would predict.
Neither gap is just shot volume or position in disguise. Controlling for field goal attempts per 36 (how much offensive load a player carries) and whether the player is a traditional post position (PF/C, who foul more just by playing interior defense), both slopes shrink but hold: personal fouls -0.172, CI [-0.264, -0.079] — still excludes zero; free throws +0.433, CI [+0.222, +0.644] — still excludes zero, meaning even two players taking the identical number of shots per 36 minutes, the higher-paid one draws more fouls on those possessions.
| Spec | n (players) | slope / log-salary pt | 95% CI | R² | Verdict |
|---|---|---|---|---|---|
| Personal fouls/36, naive | 318 | -0.234 | [-0.314, -0.154] | 0.094 | excludes zero, p=2.3e-08 |
| Personal fouls/36, HC3 | 318 | -0.234 | [-0.310, -0.158] | 0.094 | excludes zero, p=1.5e-09 |
| Personal fouls/36, + FGA/36 + position, HC3 | 318 | -0.172 | [-0.264, -0.079] | 0.199 | excludes zero, p=0.00029 |
| Free throws/36, naive | 318 | +1.002 | [+0.807, +1.196] | 0.246 | excludes zero, p=4.1e-21 |
| Free throws/36, HC3 | 318 | +1.002 | [+0.788, +1.215] | 0.246 | excludes zero, p=3.4e-20 |
| Free throws/36, + FGA/36, HC3 | 318 | +0.433 | [+0.222, +0.644] | 0.425 | excludes zero, p=5.8e-05 |
| Personal fouls/36, G≥50 only, HC3 | 261 | -0.233 | [-0.320, -0.147] | 0.089 | excludes zero, p=1.4e-07 |
| Free throws/36, G≥50 only, HC3 | 261 | +0.936 | [+0.698, +1.173] | 0.211 | excludes zero, p=1.2e-14 |
A second, independent measure of fame agrees. Salary is a continuous proxy; being named to the 318 players' 28 2025-26 All-Star Game is a discrete, reputational one that doesn't depend on a front office's contract math. The two measures tell the same story:
| Rate | Non-All-Star (n=290) | All-Star (n=28) | Gap | Bootstrap 95% CI | Verdict |
|---|---|---|---|---|---|
| Personal fouls / 36 min | 2.99 | 2.54 | -0.45 | [-0.69, -0.21] | excludes zero, Welch p=0.0011 |
| Free throw attempts / 36 min | 3.17 | 6.91 | +3.74 | [+3.03, +4.48] | excludes zero, Welch p=6e-11 |
Robustness. Restricting to the 261 players who appeared in at least 50 of their team's games — full-season regulars, not partial-season call-ups or players returning from injury — barely moves either naive estimate: personal fouls -0.233 (CI [-0.320, -0.147]), free throws +0.936 (CI [+0.698, +1.173]). Spearman rank correlations agree in sign and significance with every OLS spec above (ρ=-0.308 for fouls, +0.448 for free throws, both p<1e-7).
Read plainly: in this one season, higher-paid and more decorated NBA players get a measurably different whistle than everyone else, in both directions, and it is not fully explained by how much they shoot or where they play on the floor. What this design cannot do is separate a biased whistle from a real, legitimate mechanism pointing the same way — star players draw extra defensive attention by design (more contact initiated against them) and are more frequently used in isolation plays that are whistled more leniently on D for everyone involved. A single-season, no-play-by-play design can observe the gap honestly; it cannot adjudicate why it exists.
| Spec | n (players) | slope / log-salary pt | 95% CI | R² | Verdict |
|---|---|---|---|---|---|
| Personal fouls/36, naive | 318 | -0.234 | [-0.314, -0.154] | 0.094 | excludes zero, p=2.3e-08 |
| Personal fouls/36, HC3 | 318 | -0.234 | [-0.310, -0.158] | 0.094 | excludes zero, p=1.5e-09 |
| Personal fouls/36, + FGA/36 + position, HC3 | 318 | -0.172 | [-0.264, -0.079] | 0.199 | excludes zero, p=0.00029 |
| Free throws/36, naive | 318 | +1.002 | [+0.807, +1.196] | 0.246 | excludes zero, p=4.1e-21 |
| Free throws/36, HC3 | 318 | +1.002 | [+0.788, +1.215] | 0.246 | excludes zero, p=3.4e-20 |
| Free throws/36, + FGA/36, HC3 | 318 | +0.433 | [+0.222, +0.644] | 0.425 | excludes zero, p=5.8e-05 |
| Personal fouls/36, G≥50 only, HC3 | 261 | -0.233 | [-0.320, -0.147] | 0.089 | excludes zero, p=1.4e-07 |
| Free throws/36, G≥50 only, HC3 | 261 | +0.936 | [+0.698, +1.173] | 0.211 | excludes zero, p=1.2e-14 |
| Rate | Non-All-Star (n=290) | All-Star (n=28) | Gap | Bootstrap 95% CI | Verdict |
|---|---|---|---|---|---|
| Personal fouls / 36 min | 2.99 | 2.54 | -0.45 | [-0.69, -0.21] | excludes zero, Welch p=0.0011 |
| Free throw attempts / 36 min | 3.17 | 6.91 | +3.74 | [+3.03, +4.48] | excludes zero, Welch p=6e-11 |
| Player | Team | Pos | 2026-27 salary | PF/36 | FTA/36 |
|---|---|---|---|---|---|
| Stephen Curry ★ | GSW | PG | $62.6M | 1.98 | 5.94 |
| Nikola Jokić ★ | DEN | C | $59.0M | 2.79 | 7.66 |
| Giannis Antetokounmpo ★ | MIL | PF | $58.5M | 2.99 | 12.33 |
| Anthony Davis | DAL | PF | $58.5M | 2.42 | 4.72 |
| Joel Embiid | PHI | C | $58.1M | 2.51 | 10.03 |
| Karl-Anthony Towns ★ | NYK | C | $57.1M | 3.95 | 6.39 |
| Jaylen Brown ★ | BOS | SF | $57.1M | 2.83 | 7.85 |
| Devin Booker ★ | PHO | SG | $57.1M | 2.79 | 8.70 |
| Jimmy Butler | GSW | SF | $56.8M | 1.39 | 8.80 |
| Paul George | PHI | PF | $54.1M | 2.70 | 3.52 |
| Kawhi Leonard ★ | LAC | SF | $50.3M | 1.35 | 7.18 |
| Cade Cunningham ★ | DET | PG | $50.1M | 3.29 | 6.37 |
| Donovan Mitchell ★ | CLE | SG | $50.1M | 2.47 | 6.56 |
| Jamal Murray ★ | DEN | PG | $50.1M | 1.73 | 5.29 |
| Evan Mobley | CLE | PF | $50.1M | 2.71 | 5.19 |
★ = 2025-26 All-Star.
Method. Basketball-Reference's season per-game table
(/leagues/NBA_2026_per_game.html, the 2025-26 season) scraped live via
pandas.read_html, a browser user-agent (a plain request UA 403s some
Sports-Reference pages, as already noted in this desk's run 511). Traded players'
per-team split rows were dropped in favor of Basketball-Reference's own combined-team
row ("2TM"/"3TM"), so no player is double-counted. Filtered to players appearing in
at least 20 games and averaging at least 15 minutes — a reliable-rate floor;
below it, per-36-minute rates swing wildly on tiny minute totals. Salary is each
player's 2026-27 season figure from Basketball-Reference's own contracts page, joined
on exact player name; 318 of 350 rate-eligible players had a salary on file
(free agents, two-way and non-guaranteed deals excluded by the source, not by this
run). All-Star status is Basketball-Reference's own "AS" award tag for the 2025-26
season.
Limits, stated plainly. Using next season's (2026-27) already-signed salary as the proxy for the season the foul data comes from (2025-26) is a deliberate substitution, not an error: NBA contracts are multi-year and the large majority of players do not reprice between consecutive seasons, but rookies on new deals and players who changed tiers (a breakout season earning a new contract, an injury costing one) add noise in the direction of understating, not inventing, this relationship. This is a single-season, player-level design with no play-by-play or shot-location data — it cannot separate a biased whistle from the legitimate mechanism that star players draw more defensive attention and more frequently initiate contact by design. No team-pace or opponent-strength control: teams that play faster generate more possessions and more foul opportunities for everyone on the floor, stars included, and this run does not isolate that.
refbias_584.csv (player, team, pos, is_big, g, mp_per_g, pf36, fta36, fga36, salary, log_salary, all_star) · fit output (JSON).