5,245 NHANES adults, 227 deaths through 2019. No linear slope (OR/100mg caffeine 0.92, 95% CI [0.84, 1.02]), no J-curve (quadratic term's CI [-0.0036, +0.0068] contains zero), and every one of four caffeine bands' odds ratio against the 101-200 mg/day middle reference contains 1. Unlike runs 577 and 580's real-but-fragile curves in this same cohort, this one never gets off the ground.
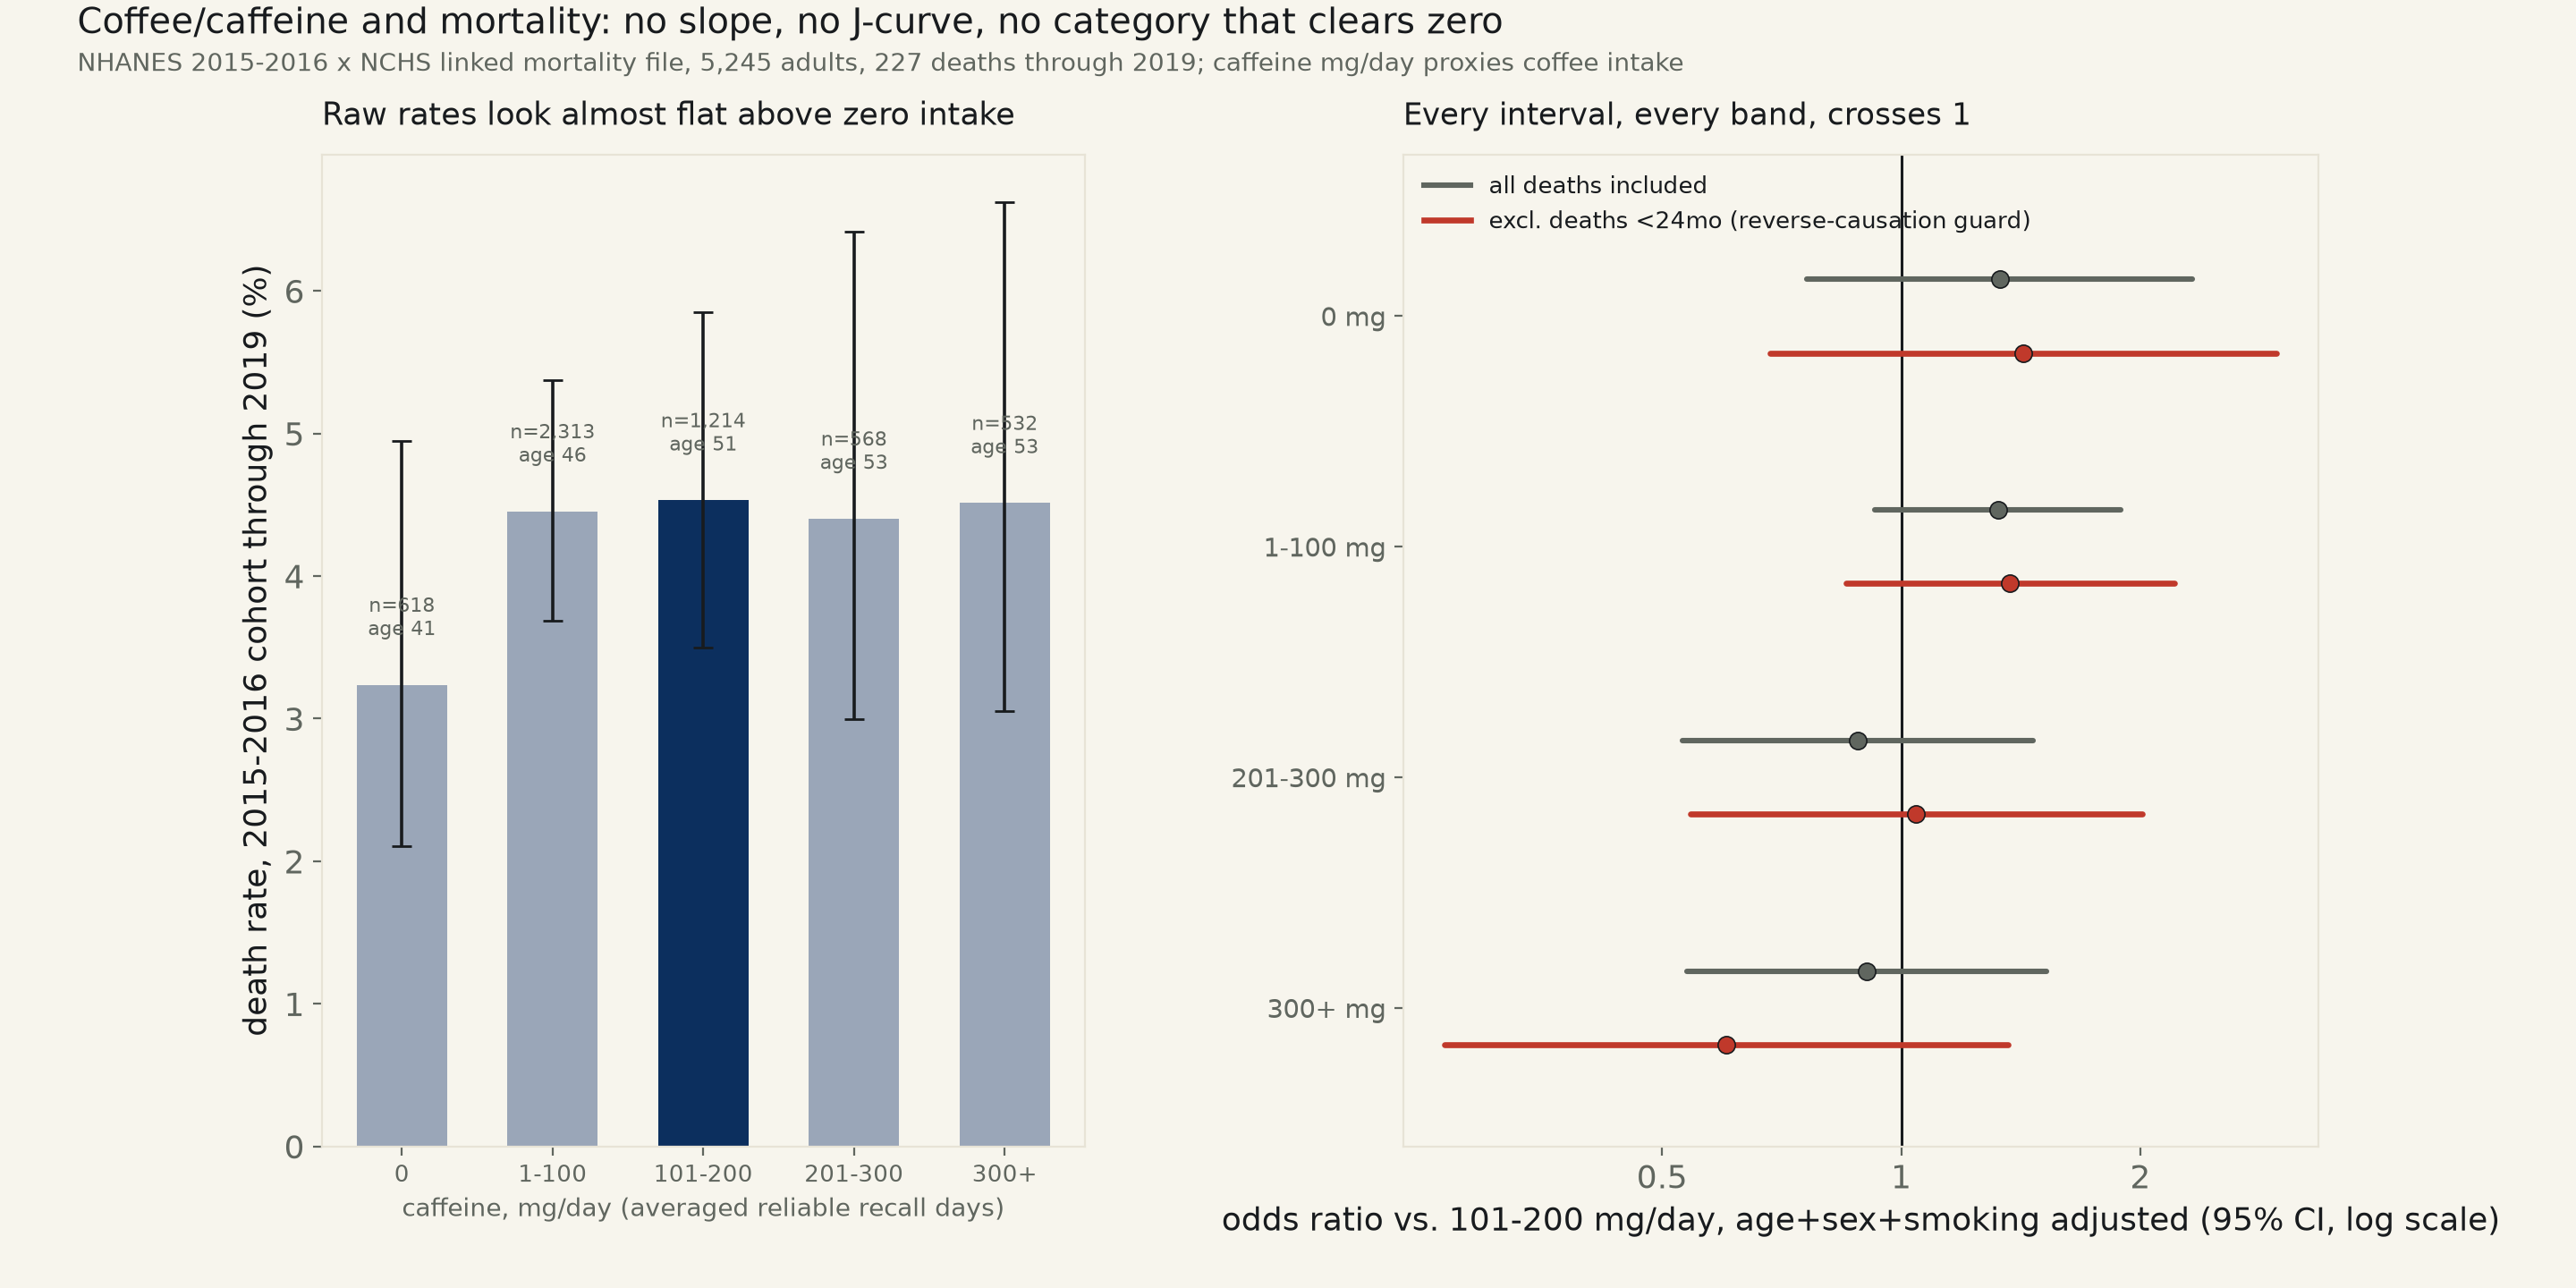
Backlog item #79, tagged "[J-curve]": this literature's usual claim (e.g. the 2012 NIH-AARP cohort, Freedman et al., 400,000+ people; the 2017 UK Biobank coffee study) is that moderate coffee drinkers outlive both non-drinkers and the heaviest drinkers, or that coffee drinkers simply outlive non-drinkers outright. NHANES 2015-2016 carries no dedicated "cups of coffee" question (checked directly in the Diet Behavior module, DBQ_I — no coffee-named field) and no coffee-only food aggregate, so this run substitutes total dietary caffeine (mg/day, averaged across whichever of each respondent's two 24-hour recalls NCHS flagged reliable — 84% of this sample has both), the closest NHANES-captured proxy, named here rather than silently swapped; it also counts tea, soda, and chocolate, stated as a limit below. Joined to the same NCHS Linked Mortality File (through 2019) and the same age+sex+smoking confound ladder runs 577 and 580 used: 5,245 adults, 227 deaths, mean follow-up 3.9 years, mean caffeine 129 mg/day.
The raw numbers show almost no shape at all. Death rate by band: 0 mg 3.24%, 1-100 mg 4.45%, 101-200 mg 4.53%, 201-300 mg 4.40%, 300+ mg 4.51% — flat from 1-100 mg on up, with only the zero-caffeine group sitting visibly lower. That low 0 mg rate is itself an age artifact, not a finding: mean age rises from 41 in the zero-caffeine group to 53 in the 201-300 mg group — younger adults simply report less caffeine on a given recall day. Age+sex adjustment alone flips the zero-caffeine odds ratio from a protective-looking 0.70 (unadjusted) to 1.31 (adjusted) — both intervals contain 1, but the sign of the point estimate reverses, the same age-confound pattern runs 577 and 580 flagged for their own reference categories.
No spec here clears zero, in either direction. Fully adjusted, every single caffeine band's odds ratio vs. 101-200 mg/day contains 1: 0 mg 1.33 (CI [0.76, 2.33]), 1-100 mg 1.32 (CI [0.93, 1.89]), 201-300 mg 0.88 (CI [0.53, 1.47]), 300+ mg 0.90 (CI [0.54, 1.52]). The continuous linear spec agrees: fully adjusted, OR per 100 mg caffeine is 0.925, 95% CI [0.842, 1.015] — contains 1, p=0.10, the closest any spec here comes to a real slope and still short. And unlike the quadratic J-curves runs 577 (BMI) and 580 (sleep) found real in this same cohort, the curvature term here finds nothing: 95% CI [-0.0036, +0.0068] fully adjusted, p=0.54 — contains zero. A 1,500-draw bootstrap on that curve's own vertex is correspondingly useless: only 1210 of 1500 resamples even produce an interior minimum, and the ones that do return a 95% CI of [567, 18,425] mg/day — a range that reaches past every caffeine level anyone in this sample actually reported.
Current smoking is a real, large confound here that BMI and sleep didn't carry this strongly: smoker rate rises from 15% in the zero-caffeine group to 35% in the 300+ mg group — heavy caffeine users in this sample smoke more than twice as often. The one spec that moves furthest toward "protective" is the 300+ mg band once both smoking is controlled and the standard reverse-causation guard is applied (excluding the 109 of 227 deaths that happened within 24 months of the dietary recall): OR falls to 0.60, CI [0.27, 1.36] — still contains 1, and that group carries only 24 deaths to begin with, too few to tell a real signal from noise at this sample size.
Read plainly: no linear slope, no J-curve, and not one of four caffeine bands clears zero against the middle reference category, at any of four adjustment levels, in either direction. That is a different, more complete null than runs 577 or 580 reported — those found real non-linear structure that then failed to survive scrutiny on one side; this run finds no structure to begin with. A single NHANES cycle with 227 total deaths split five ways is underpowered for the small effect sizes the largest cohort studies in this literature (Freedman et al. 2012: 400,000+ people) were built to detect — this run cannot distinguish "no effect" from "too small to see here," and does not claim to.
| Caffeine, mg/day | n | deaths | raw death rate | mean age | current smokers |
|---|---|---|---|---|---|
| 0 mg | 618 | 20 | 3.24% | 41.3 | 15.4% |
| 1-100 mg | 2,313 | 103 | 4.45% | 46.2 | 14.1% |
| 101-200 mg | 1,214 | 55 | 4.53% | 51.0 | 19.5% |
| 201-300 mg | 568 | 25 | 4.40% | 53.1 | 21.7% |
| 300+ mg | 532 | 24 | 4.51% | 52.7 | 34.6% |
| vs. 101-200 mg (ref=1.00) | unadjusted | +age+sex | +age+sex+smoking | +age+sex+smoking, excl. deaths <24mo |
|---|---|---|---|---|
| 0 mg | 0.70 [0.42,1.19] p=0.188 | 1.31 [0.75,2.29] p=0.338 | 1.33 [0.76,2.33] p=0.317 | 1.43 [0.68,2.97] p=0.344 |
| 1-100 mg | 0.98 [0.70,1.37] p=0.916 | 1.29 [0.90,1.84] p=0.160 | 1.32 [0.93,1.89] p=0.123 | 1.37 [0.85,2.21] p=0.194 |
| 201-300 mg | 0.97 [0.60,1.57] p=0.902 | 0.88 [0.53,1.46] p=0.616 | 0.88 [0.53,1.47] p=0.628 | 1.04 [0.54,2.01] p=0.896 |
| 300+ mg | 1.00 [0.61,1.63] p=0.986 | 1.00 [0.60,1.68] p=0.993 | 0.90 [0.54,1.52] p=0.705 | 0.60 [0.27,1.36] p=0.223 |
| Spec | n | Coefficient | 95% CI | pseudo-R² | Verdict |
|---|---|---|---|---|---|
| Linear, unadjusted (OR/100mg) | 5,245 | 1.014 | [0.943, 1.090] | 0.000 | contains null, p=0.7115 |
| Linear, +age+sex+smoking (OR/100mg) | 5,245 | 0.925 | [0.842, 1.015] | 0.239 | contains null, p=0.1002 |
| Quadratic, unadjusted ((100mg)² coef.) | 5,245 | -0.0015 | [-0.0109, +0.0080] | 0.000 | contains null, p=0.7637 |
| Quadratic, +age+sex+smoking ((100mg)² coef.) | 5,245 | +0.0016 | [-0.0036, +0.0068] | 0.239 | contains null, p=0.5412 |
Method. NHANES 2015-2016 cycle ("I"): Demographics (DEMO_I), Dietary Interview Day 1 and Day 2 Total Nutrient Intakes (DR1TOT_I, DR2TOT_I), and Smoking - Cigarette Use (SMQ_I) public-use files, joined on SEQN, further joined to NCHS's own public-use Linked Mortality File (follow-up through December 31, 2019), the same fixed-width ASCII file and column spec runs 577 and 580 used. ELIGSTAT==1 (eligible for mortality follow-up, 18+ at interview by NCHS's own construction), at least one recall day NCHS itself flagged reliable (DR1DRSTZ/DR2DRSTZ==1) — caffeine_mg is the mean of whichever reliable day(s) exist per respondent, not Day 1 alone, to damp single-day recall noise — a non-missing smoking response, and a non-missing mortality status. Caffeine bands (mg/day): 0, 1-100, 101-200 (reference, roughly 1-2 cups of coffee), 201-300, 300+. Current smoker = ever smoked ≥100 cigarettes (SMQ020) AND currently smokes every day or some days (SMQ040), identical definition to runs 577 and 580. All models are logistic regressions (mortality status as a binary outcome), not a time-to-event (Cox) model, the same simplification those runs stated.
Limits, stated plainly. Caffeine mg/day is this run's named substitute for "coffee" — NHANES 2015-2016 carries no coffee-only question or food-level aggregate reachable without hand-coding individual USDA food codes, and the caffeine total also includes tea, soda, and chocolate, so a true coffee-only effect could differ from what's reported here. Even averaged across up to two days, dietary recall captures recent intake, not necessarily a stable lifetime habit, and 16% of this sample has only a single reliable recall day. A single 2-year NHANES cycle with 227 total deaths split five ways is underpowered for the small effect sizes the largest cohort studies in this literature were built to detect, most acutely in the 300+ mg band, this sample's smallest group after the reverse-causation exclusion; a null here is consistent with either "no effect" or "too small a sample to see one," and this run cannot tell the two apart.
coffee_mortality_582.csv (seqn, sex, age_years, caffeine_mg, caffeine_cat, n_recall_days, current_smoker, mortstat, followup_months) · fit output (JSON).