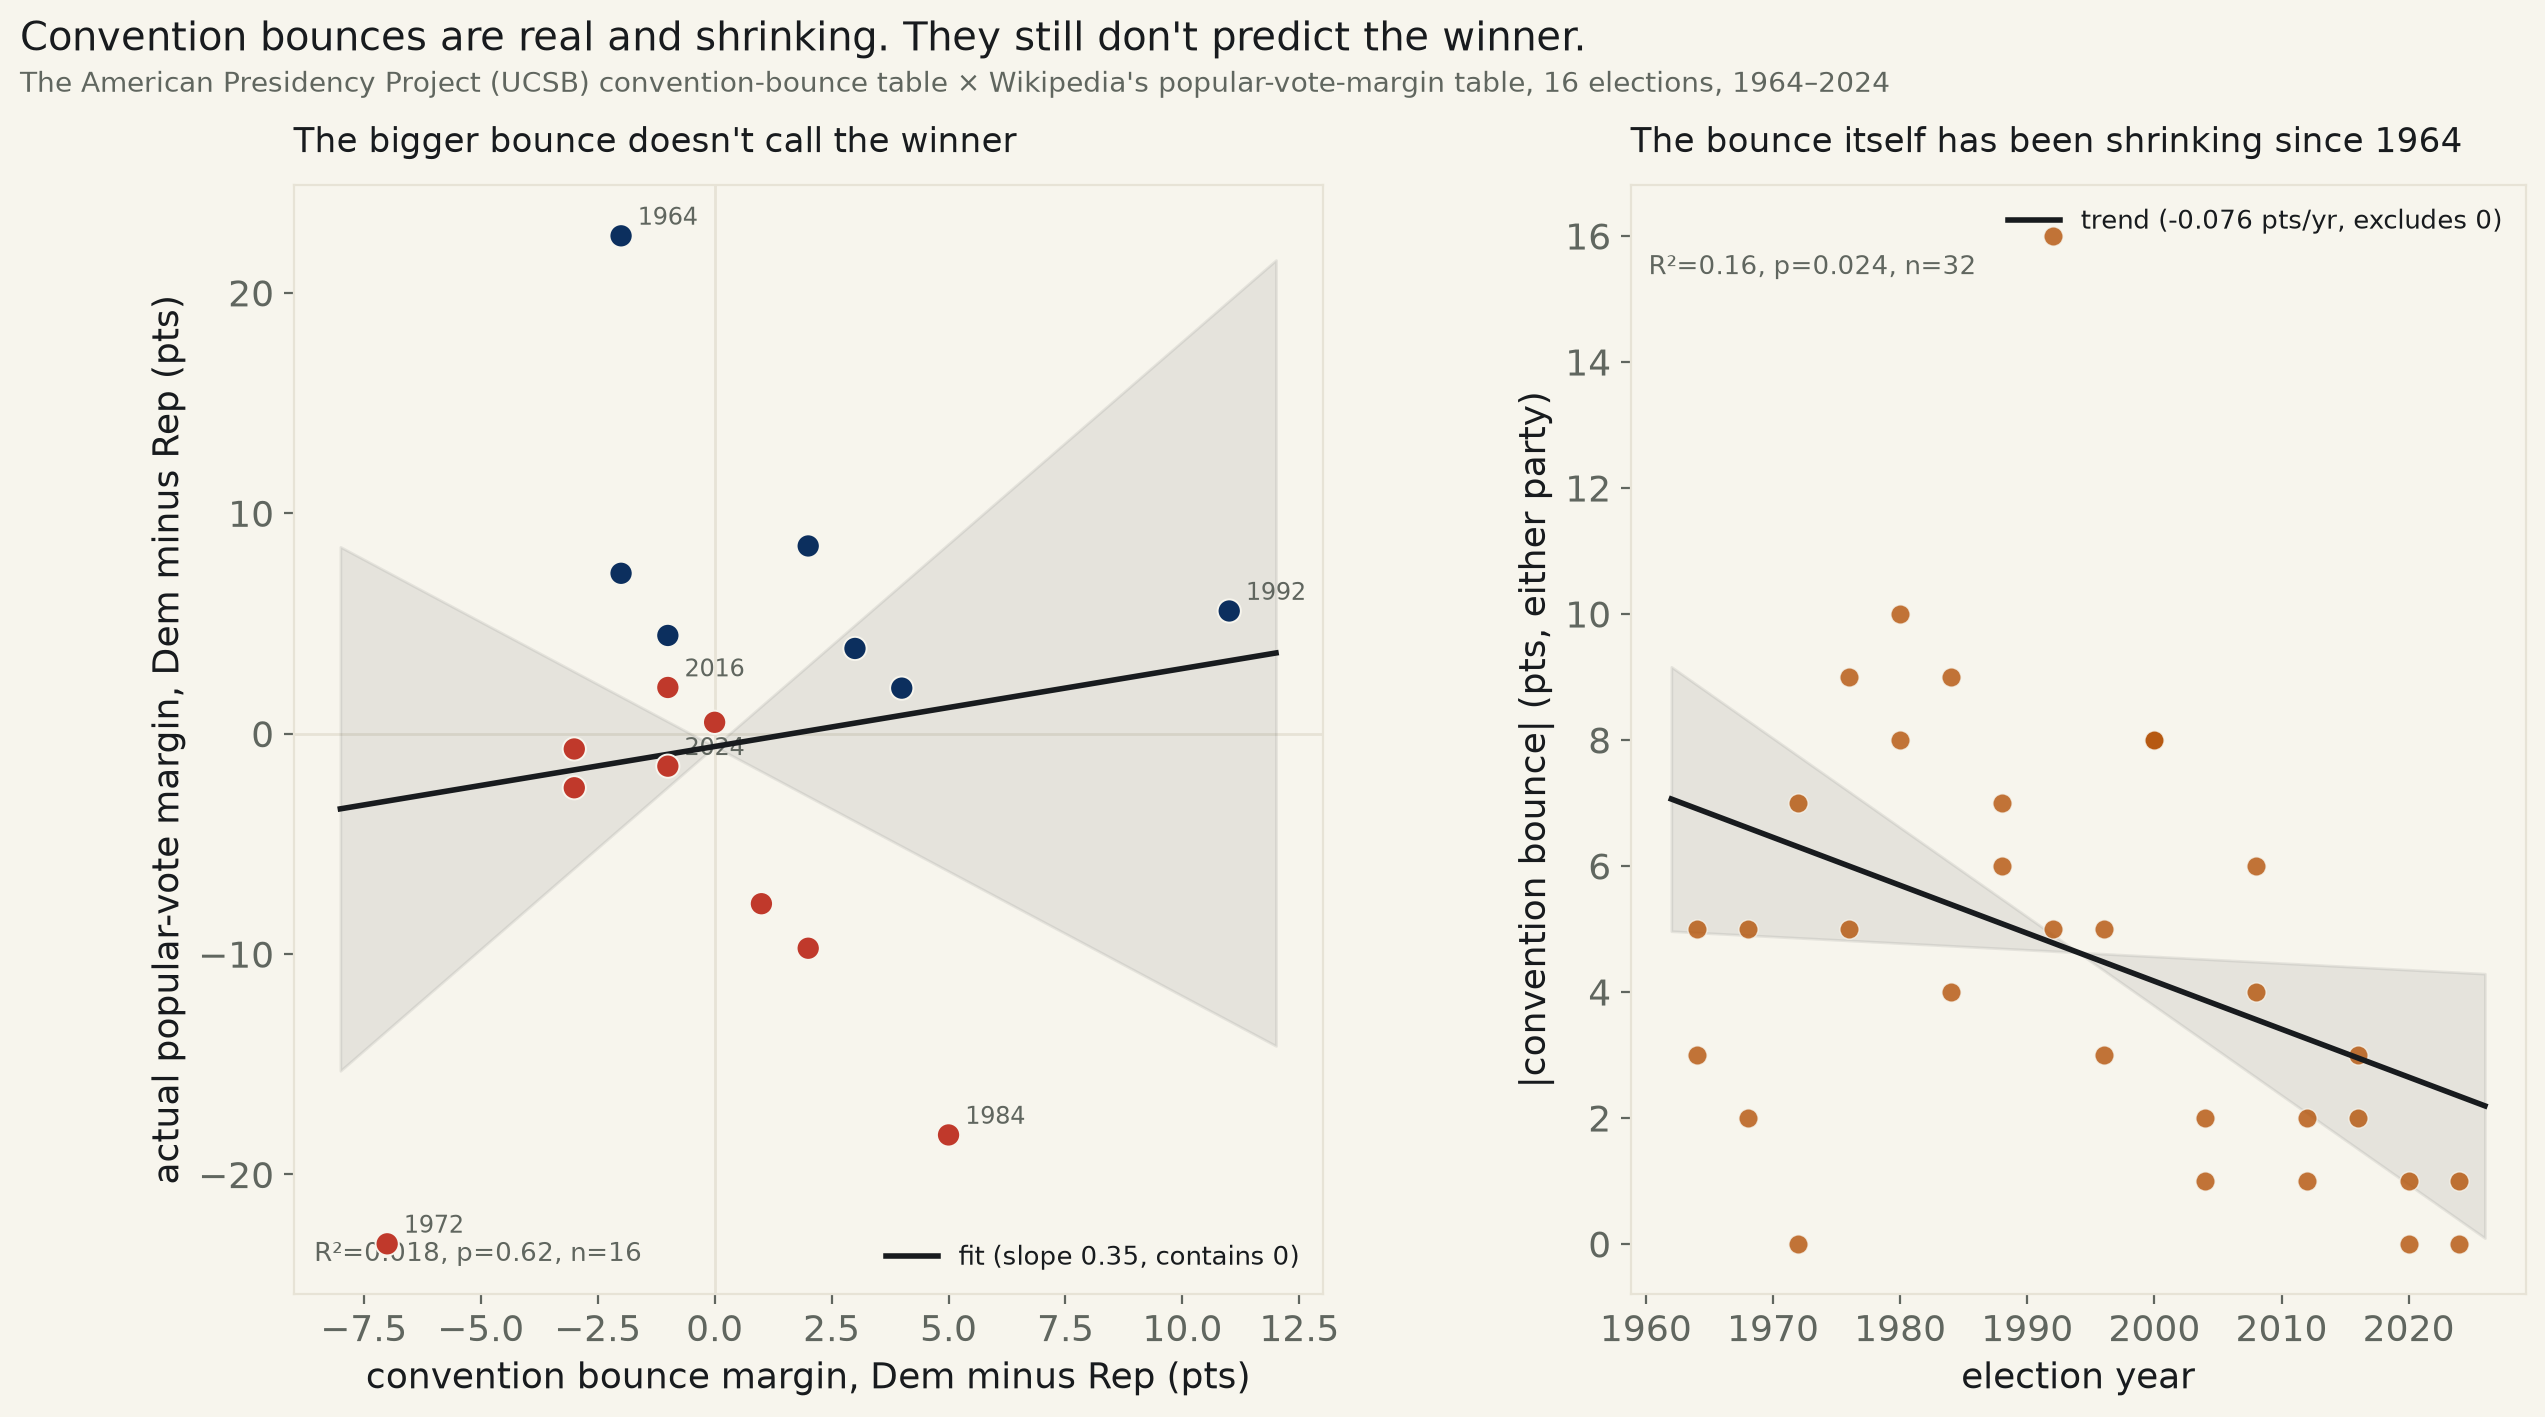
16 elections, 1964–2024. The nominee with the bigger convention bounce wins the popular vote 53.3% of the time, 95% CI [30.1%, 75.2%] — a coin flip. The continuous version agrees: bounce margin vs. actual margin, slope +0.35, CI [-1.13, +1.84] — contains zero. The one thing that is real: the bounce itself has been shrinking since 1964.
Every national party convention produces a post-convention polling bump for its nominee — the "convention bounce," tracked by Gallup since 1964 and, after Gallup retired its general-election trial-heat polling in 2015, recalculated by the American Presidency Project from Real Clear Politics and 538 averages instead. The Presidency Project's own table runs 1964–2024, one bounce figure per nominee per cycle, 32 nominee-cycles across 16 elections. This run joins that table to the actual, certified popular-vote margin for the same 16 elections and asks the question the bounce is implicitly supposed to answer: does the candidate who gets the bigger bounce go on to win?
No. Regressing the bounce margin (Dem minus Rep, in points) against the actual Election Day popular-vote margin (Dem minus Rep), across all 16 elections: slope +0.35, 95% CI [-1.13, +1.84] — contains zero. R²=0.018, p=0.62. A bigger bounce margin is not associated with a bigger (or smaller) margin on Election Day, in either direction, in this 60-year record.
The plainer version of the same test: did the nominee with the larger bounce simply go on to win the popular vote? Excluding the one exact tie (2000, Gore and Bush both at 8 points), the bigger-bounce candidate won 8 of 15 elections — 53.3%, 95% CI [30.1%, 75.2%]. That interval sits almost exactly on top of 50%. A coin flip calls the winner about as well as the bounce does.
Not an artifact of the two biggest landslides. 1972 and 1984 are this record's sharpest mismatches: the losing nominee (McGovern, Mondale) carried the bigger bounce both times, then lost by more than 18 points. Dropping those two years, the already-flat main fit goes flatter still: slope -0.05, 95% CI [-1.38, +1.27], R²=0.0006, p=0.93, n=14. The null isn't two outliers dragging a real relationship down to nothing; the other 14 elections alone carry no relationship either.
One real trend did turn up, looking at the bounce on its own terms. Pooling both parties' bounce size (absolute value, ignoring sign) against the election year, all 32 nominee-cycles: slope -0.0761 points per year, 95% CI [-0.1417, -0.0105] — excludes zero, R²=0.16, p=0.024. The bounce itself has been shrinking for sixty years: four nominees since 2016 registered a bounce of 1 point or less, something that happened only once (McGovern, 1972, a bounce of exactly zero) in the preceding eleven cycles. This run does not test why — a more fragmented media environment and a shrinking pool of persuadable late-deciding voters are the standard explanations in the literature, not something fit here.
Read plainly. The convention bounce is a real, measurable, shrinking phenomenon. Whether a nominee gets a big one or a small one tells a reader nothing about who wins in November, in a dataset running back to 1964 and surviving the removal of its two biggest landslide years.
| Year | Dem bounce | Rep bounce | Bounce margin (D−R) | Actual margin (D−R) | Verdict |
|---|---|---|---|---|---|
| 1964 | +3 | +5 | -2 | +22.58 | missed |
| 1968 | +2 | +5 | -3 | -0.70 | called it |
| 1972 | +0 | +7 | -7 | -23.15 | called it |
| 1976 | +9 | +5 | +4 | +2.06 | called it |
| 1980 | +10 | +8 | +2 | -9.74 | missed |
| 1984 | +9 | +4 | +5 | -18.21 | missed |
| 1988 | +7 | +6 | +1 | -7.72 | missed |
| 1992 | +16 | +5 | +11 | +5.56 | called it |
| 1996 | +5 | +3 | +2 | +8.51 | called it |
| 2000 | +8 | +8 | +0 | +0.51 | tie (0 bounce margin) |
| 2004 | -1 | +2 | -3 | -2.46 | called it |
| 2008 | +4 | +6 | -2 | +7.27 | missed |
| 2012 | +2 | -1 | +3 | +3.86 | called it |
| 2016 | +2 | +3 | -1 | +2.09 | missed |
| 2020 | +0 | +1 | -1 | +4.45 | missed |
| 2024 | +0 | +1 | -1 | -1.48 | called it |
Dropping 1972 and 1984, this record's two sharpest wrong-direction landslides: slope -0.05, 95% CI [-1.38, +1.27], R²=0.0006, p=0.93, n=14 — still contains zero.
Bounce size itself vs. year (both parties pooled, n=32): slope -0.0761 pts/yr, 95% CI [-0.1417, -0.0105] — excludes zero, R²=0.16, p=0.024.
Method. Source 1: The American Presidency Project (UCSB), "The Post-Convention
Bounce in Voter Preference, 1964-2024" (node/324134) — Gallup trial-heat polling
1964-2012, the Presidency Project's own Real Clear Politics/538-average calculation
2016-2024 (per the table's own footnote, Gallup stopped running general-election
trial-heat polls after 2015). Source 2: Wikipedia's "List of United States presidential
elections by popular vote margin," cited to the Washington Post (2024) and UCSB (2024).
Both pulled live with pandas.read_html, no key, no manual transcription.
Bounce margin and actual margin are both signed Dem-minus-Rep so they are directly
comparable; the source table's own "margin" column is signed relative to the Electoral
College winner, which the fetch script converts (e.g. 2000's winner, Bush, is recorded
at margin −0.51%, meaning he lost the popular vote by that amount — converted
here to a Dem margin of +0.51). Backlog item #9 named "Wikipedia polling" for a VP-pick
polling study; no isolable running-mate polling series exists, so this run tests the
adjacent, better-sourced claim in the same backlog line — the convention bounce
itself — instead, named here rather than silently substituted.
Limits, stated plainly. n=16 elections is the entire available record since Gallup began tracking bounces in 1964, not a sample from a larger population — the width of every confidence interval here reflects that real ceiling, not a fixable collection gap. The pre-2016 and post-2016 bounce figures come from two different measurement methods (Gallup trial heats vs. an averaged-polls calculation), a methodology break the source table documents but this run does not model separately; a few points of the apparent shrinkage in the right-hand panel could be measurement-method artifact rather than pure trend. "Actual margin" is the national popular vote, not the Electoral College outcome that actually decides the presidency — 2000 and 2016 are both counted here by the popular-vote winner, who lost the actual election both times.
convention_bounce_579.csv (32 rows: year, party, nominee, bounce points) · election_results_579.csv (16 rows: year, winner, party, popular-vote margin) · fit output (JSON).