469 real alpha-emitting nuclides, IAEA's own Live Chart of Nuclides, fetched live. The 1911 Geiger–Nuttall law, pooled across every element at once, explains almost nothing — R²=0.05. Split by proton number and the law each element family actually obeys is nearly exact, R²=0.78–0.93 in every band tested. Put proton number back into one regression and the pooled fit nearly closes the book: R²=0.946.
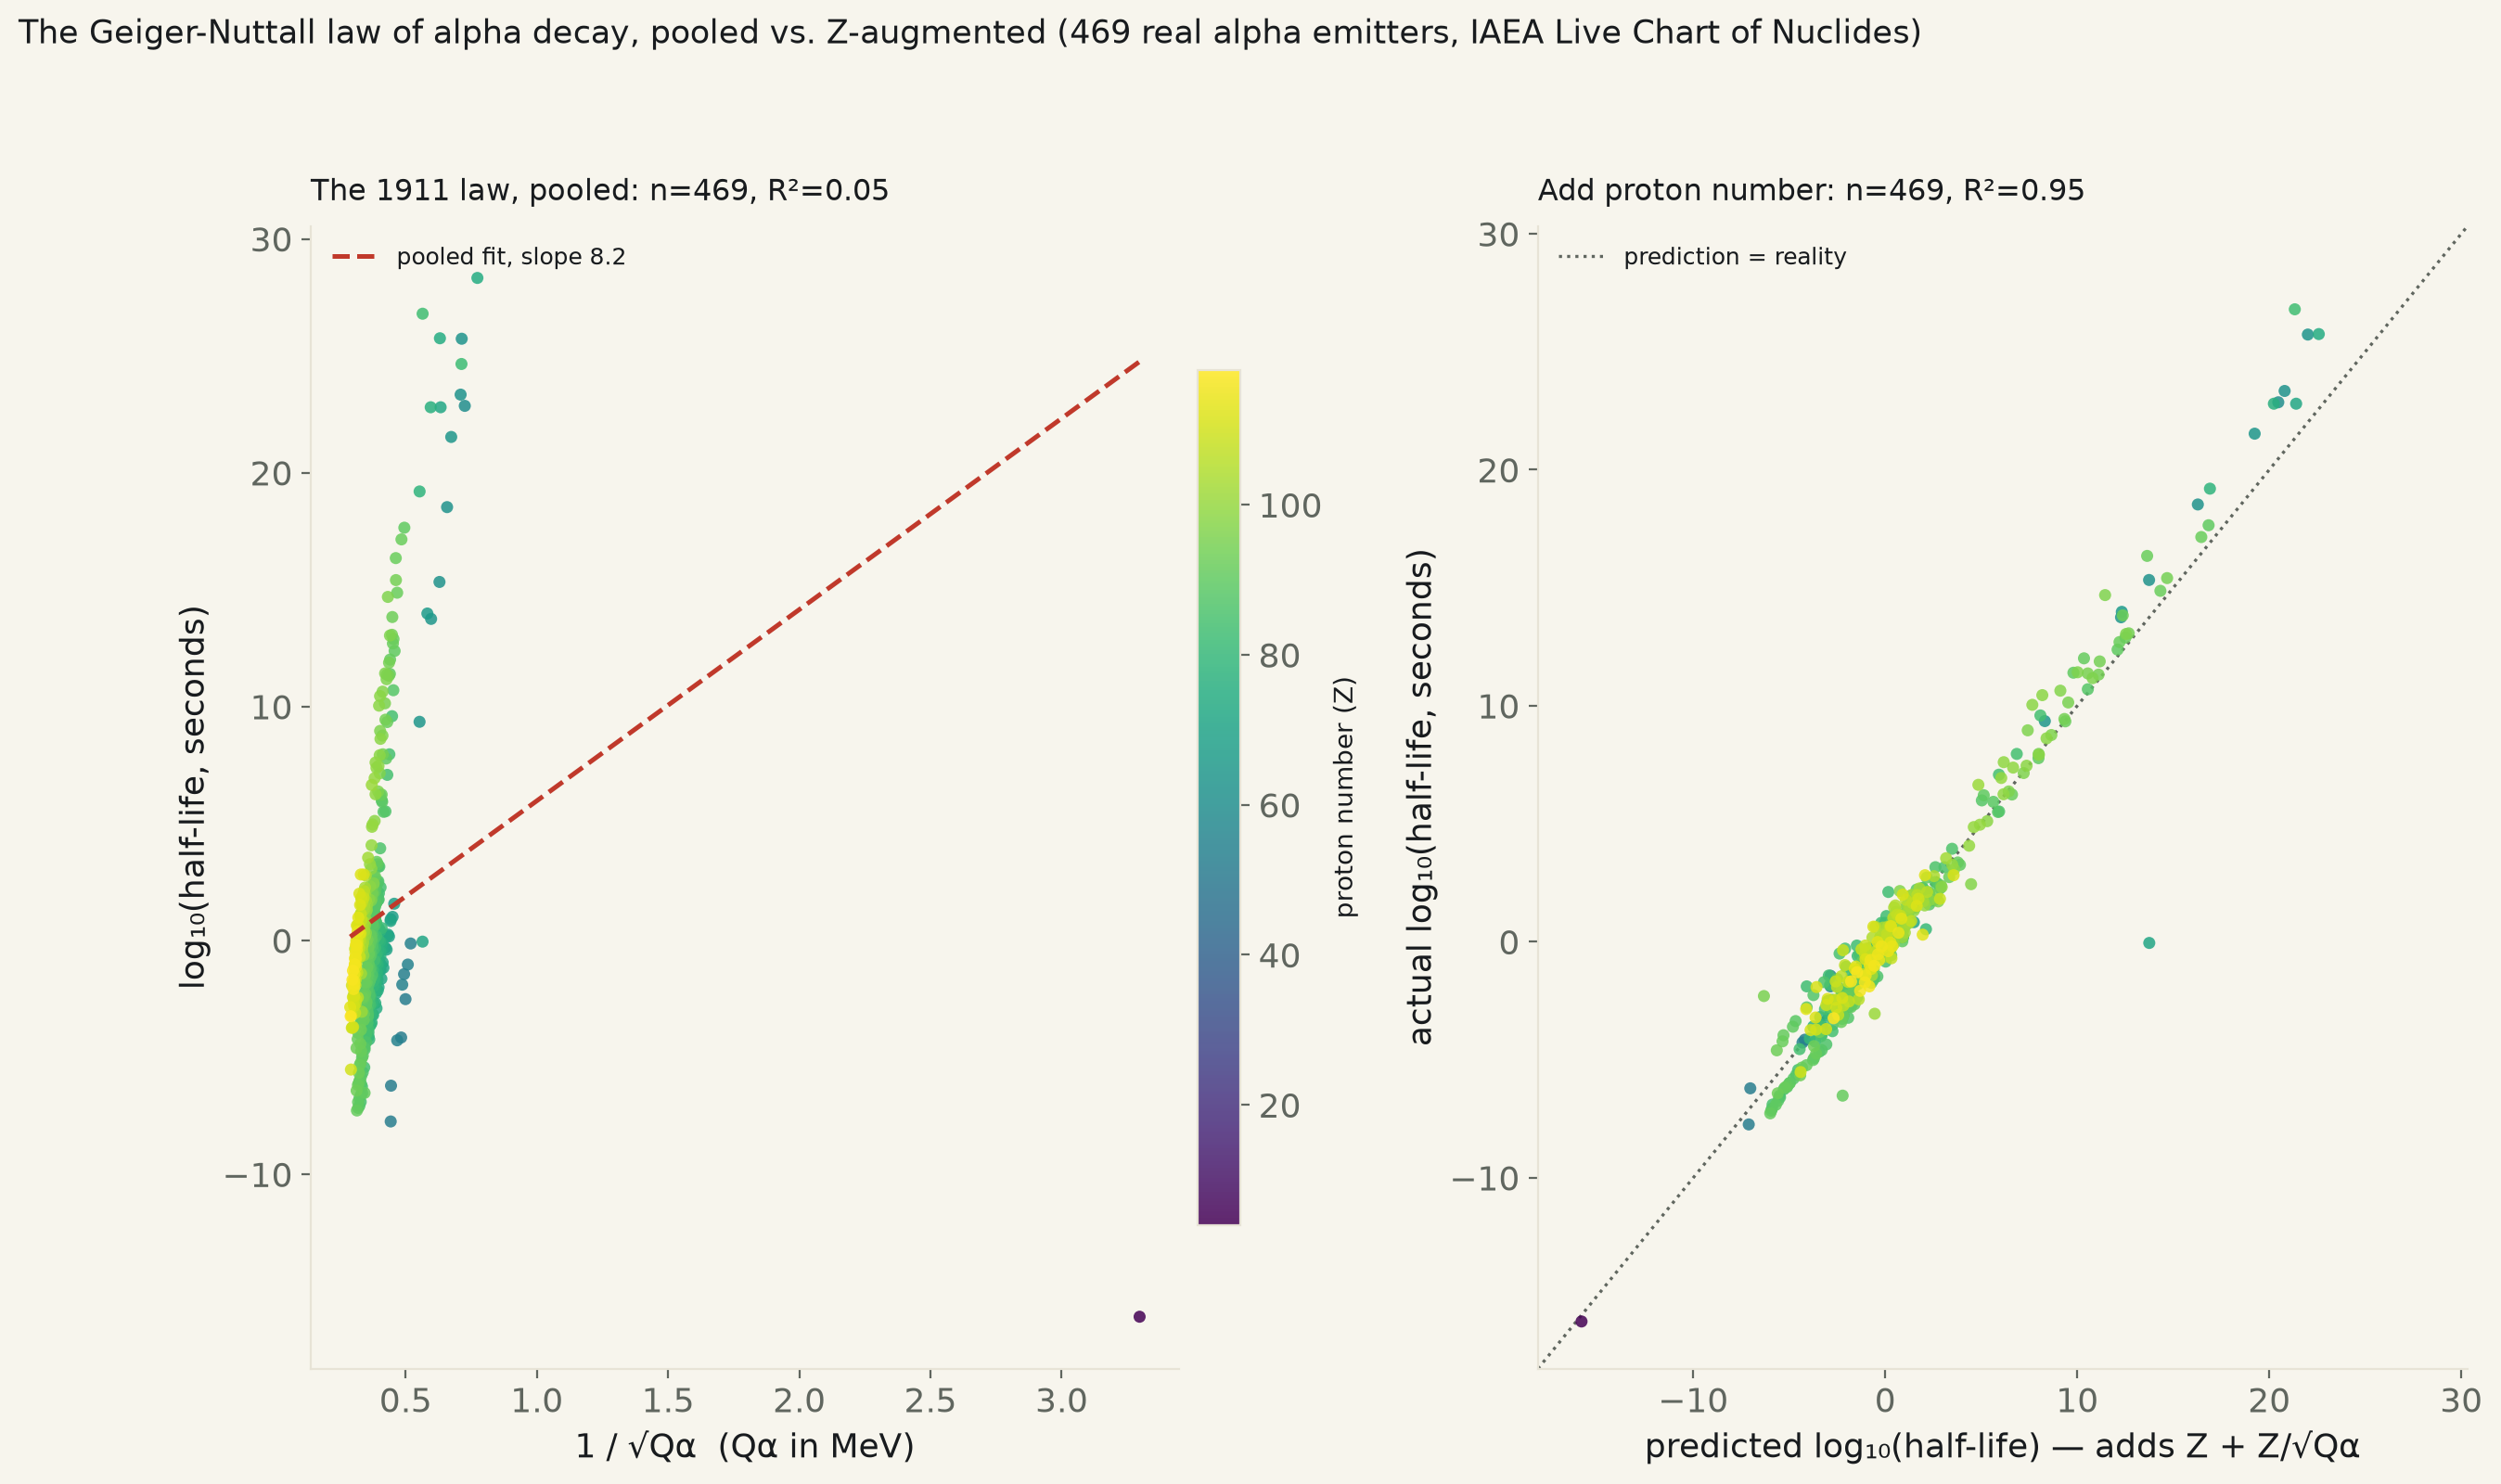
The Geiger–Nuttall law is one of the oldest quantitative claims in nuclear physics, predating quantum mechanics by sixteen years: in 1911, working off the three natural radioactive decay series, Hans Geiger and John Mitchell Nuttall noticed that the faster an atom's alpha particle flies out (the more decay energy it releases), the shorter the atom's half-life — and that the relationship looked linear once you plotted log(half-life) against the inverse square root of that energy. It would not get its real explanation until George Gamow's 1928 quantum-tunneling theory, which is still the textbook account of why: a few hundred keV of extra energy can change an alpha particle's odds of tunneling through the nuclear barrier by many orders of magnitude, which is why alpha half-lives span more than 40 decades, from microseconds to longer than the age of the universe, while the decay energies driving that swing vary by less than a factor of 20. This run pulls every figure live from the IAEA's own Live Chart of Nuclides — decay energy (Q₅) and half-life for every ground-state nuclide whose primary decay mode is alpha emission — 469 nuclides, proton number 4 to 118 — and asks how far the original 1911 version of the law gets on its own.
Pooled across every element at once, the 1911 law barely holds together. Regressing log₁₀(half-life) on 1/√Q₅ alone, across all 469 nuclides, gives slope 8.18, 95% CI [+4.81, +11.55] — technically excludes zero, p<0.001, so there is a real relationship in the predicted direction. But R² is 0.05. One single-variable predictor is explaining about 5% of a quantity that spans 40 orders of magnitude. Dropping the single lightest-element outlier in the set, beryllium-8 (Z=4, a borderline-bound curiosity that decays in attoseconds), moves the slope but not the real story: R² rises only to 0.60 on the remaining 468 nuclides, still a loose fit.
Split the same data by proton number and the loose cloud resolves into tight, nearly parallel lines. Within each of four element bands tested, the identical single-predictor fit performs completely differently: Z 50-83 (n=102, R²=0.80), Z 84-91 (n=176, R²=0.93), Z 92-103 (n=104, R²=0.92), Z 104-118 (n=86, R²=0.78). Every band clears R²≥0.78, most above 0.9 — the law Geiger and Nuttall actually saw in 1911, which was built from three decay chains, not a pooled fit across the periodic table.
Put proton number back into one regression, and the pooled fit nearly closes the book.
| Term | coefficient | 95% CI (OLS) | p (OLS) | 95% CI (HC3-robust) | p (HC3) |
|---|---|---|---|---|---|
| Intercept | -30.298 | [-31.629, -28.967] | p<0.001 | [-37.497, -23.099] | p<0.001 |
| 1/√Q₅ alone | -1.125 | [-2.115, -0.136] | p=0.026 | [-19.066, +16.816] | p=0.90 |
| Z (proton number) | -0.179 | [-0.191, -0.167] | p<0.001 | [-0.263, -0.095] | p<0.001 |
| Z × 1/√Q₅ | +1.433 | [+1.400, +1.465] | p<0.001 | [+1.169, +1.696] | p<0.001 |
Full model: log₁₀(half-life) ~ 1/√Q₅ + Z + Z·(1/√Q₅). R²=0.946, n=469. Nested F-test vs. the energy-only model: F=3883, 2 added terms, p≈7e-291.
This is the structural idea behind the 1966 Viola–Seaborg generalization of the original law: decay energy interacting with how many protons are doing the repelling. A nested F-test confirms the two added terms are not noise dressed up as signal — F=3883 on 2 degrees of freedom, p≈7e-291. The result survives dropping beryllium-8 (R²=0.946 on the remaining 468 nuclides, essentially unchanged) and survives HC3-robust standard errors, which do not assume the same scatter at every energy level.The HC3-robust check surfaces one honest wrinkle. Once proton number and its interaction with decay energy are both in the model, the plain, non-interacting 1/√Q₅ term's own coefficient can no longer be told apart from zero under robust SE — CI [-19.07, +16.82], p=0.90. Decay energy is not doing independent, additive work in this model; it is doing all of its work through its interaction with the element, Z×(1/√Q₅), whose own coefficient stays overwhelming under the same robust check (p<0.001). Read plainly: there is no universal "faster decay, shorter half-life" line that holds the same way for every element — there is a family of element-specific lines, and the 1911 law is the shape of each one, not the shape of the periodic table pooled together.
| Specification | slope | 95% CI | R² | p | n |
|---|---|---|---|---|---|
| Pooled, every element, log₁₀(tⅻⅻ) ~ 1/√Q₅ alone | +8.18 | [+4.81, +11.55] | 0.046 | p<0.001 | 469 |
| Same, dropping the one Z<50 outlier (beryllium-8) | +65.69 | [+60.79, +70.59] | 0.598 | p<0.001 | 468 |
| Element band (by proton number Z) | n | slope | 95% CI | R² | p |
|---|---|---|---|---|---|
| Z 50-83 (tin to bismuth) | 102 | 77.15 | [69.50, 84.81] | 0.800 | p<0.001 |
| Z 84-91 (polonium to protactinium) | 176 | 130.67 | [125.21, 136.13] | 0.928 | p<0.001 |
| Z 92-103 (uranium to lawrencium) | 104 | 132.67 | [125.06, 140.29] | 0.921 | p<0.001 |
| Z 104-118 (rutherfordium to oganesson) | 86 | 112.80 | [99.87, 125.72] | 0.782 | p<0.001 |
Method. Source: IAEA's Live Chart of Nuclides REST API
(nds.iaea.org/relnsd/), fetched live at run
time — substituted for NIST, the source IDEAS.md named, because no single keyless
NIST endpoint carries half-life and decay energy together for every known alpha emitter;
IAEA's own chart republishes the same underlying ENSDF/NUBASE evaluated nuclear data.
Kept: every nuclide in its ground state (excited metastable isomers excluded, since
they can decay on a different, non-representative clock) whose IAEA-listed primary decay
mode is alpha emission (“A”) and that carries both a measured half-life
(converted to seconds) and a measured alpha-decay Q-value. OLS throughout
(scipy.stats.linregress for the single-predictor fits,
statsmodels.OLS for the three-term model, both the default and HC3-robust
covariance). Element bands for the by-Z table are fixed round-number cuts chosen before
looking at any per-band result, not fitted breakpoints.
Limits, stated plainly. This tests the structural claim behind the 1911 law — that decay energy alone governs half-life — against the generalization that adds proton number, not a replication of Viola and Seaborg's own 1966 fitted coefficients, which this run does not look up or compare against. Favored vs. unfavored alpha transitions (a real quantum-mechanical distinction tied to nuclear spin and parity that can shift a half-life by orders of magnitude at fixed energy and Z) are not flagged or controlled for here; some of the within-band scatter visible in the right-hand panel is almost certainly that effect, not noise. n=469 is every qualifying nuclide currently evaluated by IAEA, not a sample drawn from a larger population — newly synthesized superheavy nuclei (Z>110) carry unusually wide half-life uncertainties that this run takes at the chart's own central value, not propagated through the fit.
alphadecay_578.csv (Z, N, A, symbol, half-life in seconds, Q₅ in MeV, decay branch %) · fit output (JSON).