1201 months of Ken French's own SMB (small-minus-big) factor, 1926–2026. January averages +1.91% against +0.01% the rest of the year — a gap that clears zero over the full century (p=6.0e-09). Split at 1983, the year Donald Keim published the size-related seasonality in the Journal of Financial Economics: the effect he documented (p=2.5e-11 pre-1983) can no longer clear this desk's bar since (p=0.28) — and, unlike run 531's Halloween Indicator, a direct test confirms the gap itself shrank (p=1.3e-04).
The January effect is one of finance's oldest calendar anomalies: stocks, and small stocks especially, were said to rally every January, historically pinned on individual investors selling losers in December for a tax write-off and buying back in the new year. Donald Keim's 1983 paper in the Journal of Financial Economics is the study that made the size-specific version famous, showing nearly half of the small-firm premium showed up in January alone. A famous, published, size-specific anomaly is exactly the kind of thing an efficient market should arbitrage away once traders can read the paper — so this run tests the claim on the same variable Keim used, SMB (small-minus-big), across a full century of Ken French's own factor data, and asks whether the effect survived being named.
Across the whole century, the effect looks completely real. Regressing SMB's monthly return on a single January dummy, 1201 months, 1926-2026: January averages +1.91% against +0.01% for the other eleven months — a gap of +1.90 points, 95% CI [+1.26, +2.54], p=6.0e-09. A 4,000-draw year-block bootstrap puts 100% of resamples on the same side of zero. The broad market gets the identical test and fails it: Mkt-RF's own January gap is +0.57 points, 95% CI [-0.52, +1.65] — contains zero, p=0.31. This was never a market-wide seasonal; it is, and only ever was, a small-cap story.
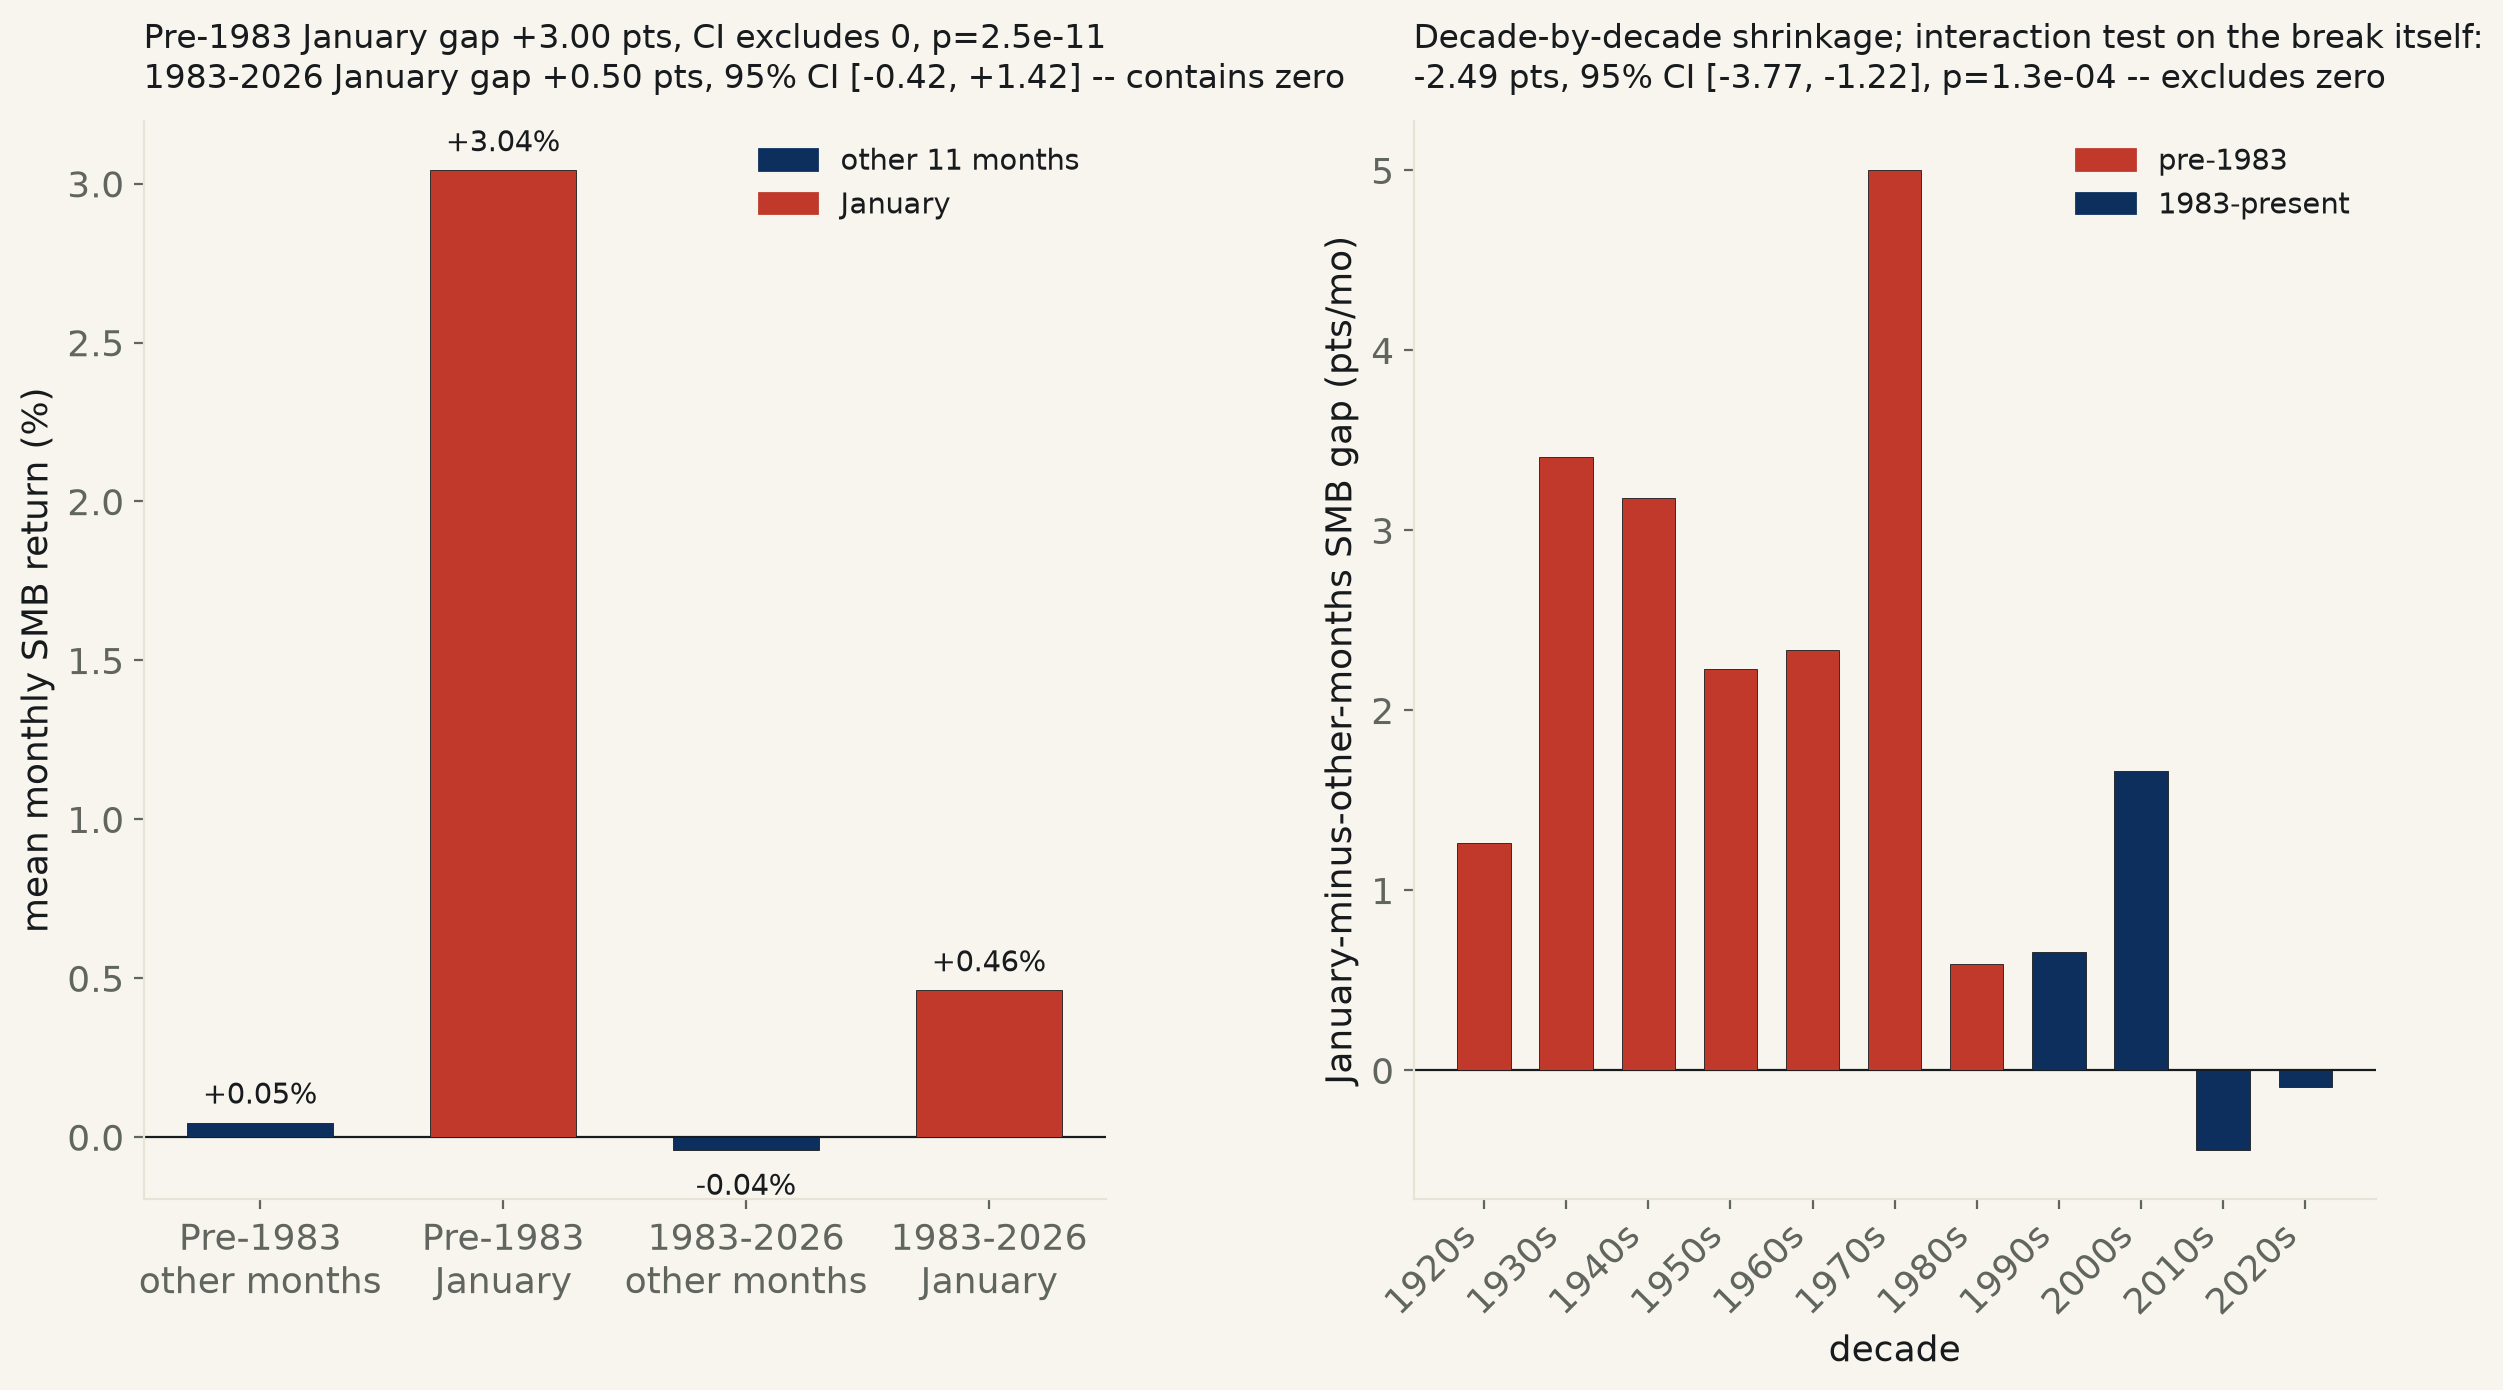
Split at Keim's own 1983 publication year and the small-cap story itself splits in two. Pre-1983 (678 months): +3.00 points, CI [+2.13, +3.86], p=2.5e-11 — excludes zero, the effect Keim actually documented. Since 1983 (523 months): +0.50 points, CI [-0.42, +1.42], p=0.28 — contains zero, cannot be confirmed at conventional significance on its own. The last 20 years are flatter still: -0.03 points, CI [-1.16, +1.09], p=0.95 — as dead a null as this desk publishes.
Unlike run 531's Halloween Indicator, the drop itself clears this desk's bar. A formal interaction term on era × January, fit on the pooled series: -2.49 points, 95% CI [-3.77, -1.22], p=1.3e-04 — excludes zero. The desk can say, plainly, that the January effect shrank after the paper that named it, not merely that the modern-era estimate alone fails to clear significance.
Concrete, no regression needed: small caps beat big caps in 71 of 100 Januarys (71%) across the full century. Since 1983, that drops to 23 of 44 (52%) — barely better than a coin flip.
Point-biserial r=+0.167 (full sample). Pre-1983 n=678, post-1983 n=523. Era interaction coefficient -2.493 pts, 95% CI [-3.767, -1.220], p=0.00013.
| Window | n (months) | January gap (pts/mo) | 95% CI | R² | Verdict |
|---|---|---|---|---|---|
| Full sample, 1926-2026 | 1201 | +1.90 | [+1.26, +2.54] | 0.028 | excludes zero, p=6e-09 |
| Pre-1983 (Keim's paper) | 678 | +3.00 | [+2.13, +3.86] | 0.064 | excludes zero, p=2.5e-11 |
| 1983-2026 (post-publication) | 523 | +0.50 | [-0.42, +1.42] | 0.002 | contains zero, p=0.28 |
| Last 20 years | 247 | -0.03 | [-1.16, +1.09] | 0.000 | contains zero, p=0.95 |
Calendar decades (not the exact 1983 split used in the regressions above), so the 1980s bar mixes four pre-1983 Januarys with six post-1983 ones.
| Decade | n Januarys | Mean January SMB | Mean other-month SMB | Gap | Era |
|---|---|---|---|---|---|
| 1920s | 3 | +0.13% | -1.14% | +1.26 | pre-1983 |
| 1930s | 10 | +3.96% | +0.55% | +3.41 | pre-1983 |
| 1940s | 10 | +3.31% | +0.13% | +3.18 | pre-1983 |
| 1950s | 10 | +1.98% | -0.25% | +2.23 | pre-1983 |
| 1960s | 10 | +2.54% | +0.21% | +2.34 | pre-1983 |
| 1970s | 10 | +4.87% | -0.13% | +5.00 | pre-1983 |
| 1980s | 10 | +0.54% | -0.05% | +0.59 | pre-1983 |
| 1990s | 10 | +0.48% | -0.18% | +0.66 | 1983-present |
| 2000s | 10 | +1.94% | +0.28% | +1.66 | 1983-present |
| 2010s | 10 | -0.42% | +0.02% | -0.44 | 1983-present |
| 2020s | 7 | -0.25% | -0.15% | -0.09 | 1983-present |
Method. Ken French Data Library's monthly 3-factor file (Mkt-RF, SMB, HML, RF), pulled fresh from Dartmouth's own keyless CSV mirror, 1201 months, 1926-07 to 2026-07 — the same canonical source used by run 513. is_january=1 for every calendar January, 0 otherwise. The headline regression is SMB ~ is_january with a plain-OLS 95% CI and an HC3 heteroskedasticity-robust check; a 4,000-draw year-block bootstrap cross-checks the full-sample and post-1983 slopes. The era split uses 1983 because it is Keim's real, dateable publication year, not a scan for the best-fitting break.
Limits, stated plainly. R²=0.028 on the full-sample regression is small by construction — a one-month calendar dummy explaining one month's return, not a tradable signal once transaction costs are counted. 1983 is used because it is when Keim's paper appeared in print, not because the market necessarily reacted the instant it was published; some earlier awareness or gradual pre-1983 decay is possible and not separately tested here. The recent-20-year slice (n=247) is a small sample for a volatile monthly series, so a CI that wide containing zero is a real limit on how precisely this desk can measure whether any residual effect remains, not proof the effect is exactly zero today.
ff_factors_monthly_533.csv (yyyymm, Mkt-RF, SMB, HML, RF, percent) · fit output (JSON).
