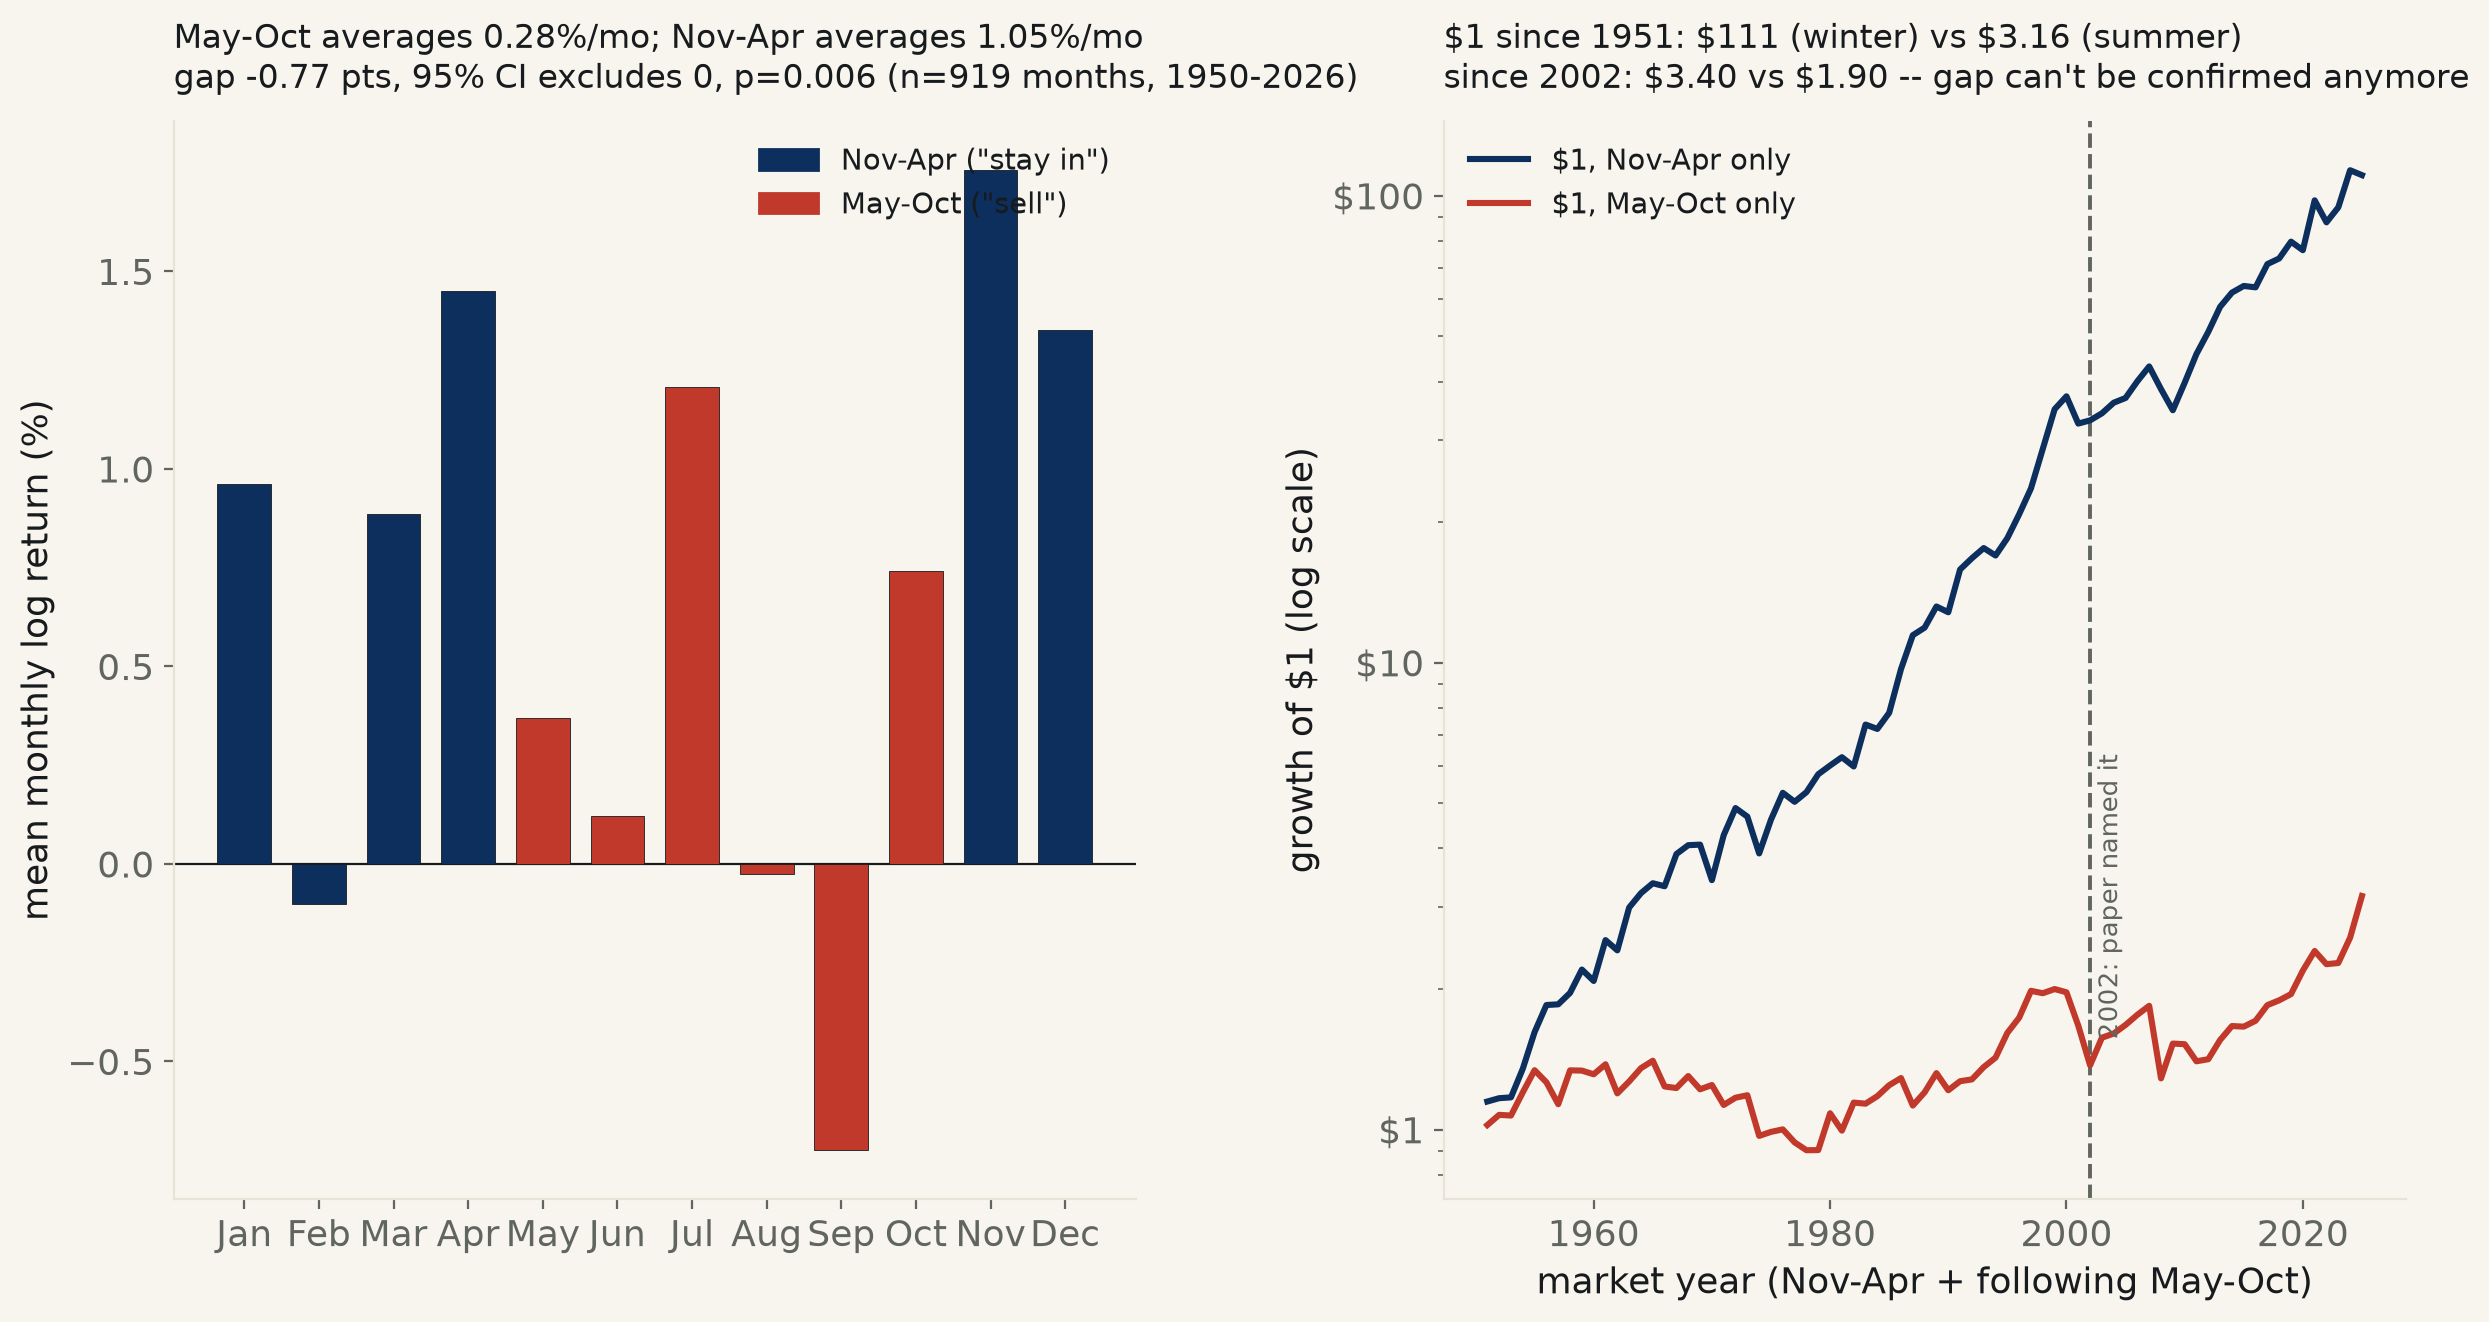
919 months of S&P 500 returns, 1950–2026. May–Oct averages +0.28%/month; Nov–Apr averages +1.05%/month — a gap that clears zero over the full 76-year record (p=0.006). Split at 2002, the year Bouman & Jacobsen published the "Halloween Indicator" in the American Economic Review: the effect that earned the name (p=0.003 pre-2002) can no longer clear this desk's bar on its own since (p=0.51) — though a direct test of whether the gap actually shrank also contains zero (p=0.28).
"Sell in May and go away, don't come back till St. Leger Day" is one of the oldest calendar rules on Wall Street — be out of stocks May through October, back in November through April. Bouman and Jacobsen gave it a name and an academic paper in 2002 (American Economic Review), calling it the "Halloween Indicator" after finding it in 36 of 37 countries they tested. A documented, published, widely repeated anomaly is exactly the kind of claim an efficient market should arbitrage away once enough people read the paper — so this run splits US history at that publication date and asks whether the effect that earned the name survived being named.
The full 76-year record says the rule was real. Regressing the S&P 500's monthly log return on a single dummy (1 for May–Oct, 0 for Nov–Apr), 1950–2026: May–Oct averages +0.28%/month against Nov–Apr's +1.05%/month — a gap of -0.77 points, 95% CI [-1.31, -0.22], p=0.006, Newey-West HAC agreeing (p=0.003). A 4,000-draw year-block bootstrap puts 100% of resamples on the same side of zero. The fit explains little of any single month's return (R²=0.008 — this is six months of accumulated drift, not a trading signal for any one month) but the six-month gap itself, compounded over decades, is not noise.
Split at the paper's own publication year and the gap changes shape. Pre-2002 (623 months): -0.97 points, CI [-1.62, -0.32], p=0.003 — excludes zero, the effect the paper actually documented. Since 2002 (296 months): -0.33 points, CI [-1.32, +0.66], p=0.51 — contains zero, cannot be confirmed at conventional significance on its own. The bootstrap agrees it's a genuine weakening, not a fluke of one test: only 79.6% of post-2002 resamples land on the "sell in May" side, short of the desk's 95% bar.
But a formal test of whether the gap itself actually shrank can't confirm that either. An interaction term on era × season, fit on the pooled series: +0.64 points, 95% CI [-0.52, +1.80], p=0.28 — contains zero. The honest statement is narrower than either "it still works" or "publication killed it": the modern era alone can no longer clear the bar this desk requires, but the desk also cannot certify that the underlying effect is smaller today than it was before 2002, only that the difference between the two eras isn't itself distinguishable from chance on this much data.
Concrete, no regression needed: $1 invested only Nov–Apr, every year, 1951–2025, compounds to $111. The identical $1 invested only May–Oct compounds to $3.16. Nov–Apr beat May–Oct in 54 of 75 market-years overall. Restricted to the 24 years since the paper (2002–2025): $1 grows to $3.40 (winter) vs. $1.90 (summer), and winter still nominally wins 17 of 24 years — the point estimate and the plain count both still lean the historical direction, they just no longer clear this desk's statistical bar alone.
Point-biserial r=-0.091 (full sample). Pre-2002 n=623, post-2002 n=296. Era interaction coefficient +0.637 pts, 95% CI [-0.523, +1.797], p=0.281.
| Market year | Nov-Apr return | May-Oct return | Which half won |
|---|---|---|---|
| 1951 | +14.8% | +2.3% | Nov-Apr |
| 1952 | +1.7% | +5.1% | May-Oct |
| 1953 | +0.4% | -0.3% | Nov-Apr |
| 1954 | +15.2% | +12.1% | Nov-Apr |
| 1955 | +19.8% | +11.5% | Nov-Apr |
| 1956 | +14.3% | -5.8% | Nov-Apr |
| 1957 | +0.4% | -10.2% | Nov-Apr |
| 1958 | +5.8% | +18.2% | May-Oct |
| 1959 | +12.2% | -0.1% | Nov-Apr |
| 1960 | -5.5% | -1.8% | May-Oct |
| 1961 | +22.3% | +5.1% | Nov-Apr |
| 1962 | -4.9% | -13.4% | Nov-Apr |
| 1963 | +23.5% | +6.0% | Nov-Apr |
| 1964 | +7.4% | +6.8% | Nov-Apr |
| 1965 | +5.0% | +3.7% | Nov-Apr |
| 1966 | -1.5% | -11.9% | Nov-Apr |
| 1967 | +17.2% | -0.8% | Nov-Apr |
| 1968 | +4.5% | +6.1% | May-Oct |
| 1969 | +0.3% | -6.3% | Nov-Apr |
| 1970 | -16.1% | +2.1% | May-Oct |
| 1971 | +24.9% | -9.4% | Nov-Apr |
| 1972 | +14.3% | +3.6% | Nov-Apr |
| 1973 | -4.1% | +1.2% | May-Oct |
| 1974 | -16.6% | -18.2% | Nov-Apr |
| 1975 | +18.1% | +2.0% | Nov-Apr |
| 1976 | +14.2% | +1.2% | Nov-Apr |
| 1977 | -4.3% | -6.2% | Nov-Apr |
| 1978 | +4.9% | -3.8% | Nov-Apr |
| 1979 | +9.2% | +0.1% | Nov-Apr |
| 1980 | +4.4% | +19.9% | May-Oct |
| 1981 | +4.2% | -8.2% | Nov-Apr |
| 1982 | -4.5% | +14.8% | May-Oct |
| 1983 | +23.0% | -0.5% | Nov-Apr |
| 1984 | -2.1% | +3.8% | May-Oct |
| 1985 | +8.3% | +5.6% | Nov-Apr |
| 1986 | +24.1% | +3.6% | Nov-Apr |
| 1987 | +18.2% | -12.7% | Nov-Apr |
| 1988 | +3.8% | +6.8% | May-Oct |
| 1989 | +11.0% | +9.9% | Nov-Apr |
| 1990 | -2.8% | -8.1% | Nov-Apr |
| 1991 | +23.5% | +4.6% | Nov-Apr |
| 1992 | +5.7% | +0.9% | Nov-Apr |
| 1993 | +5.1% | +6.3% | May-Oct |
| 1994 | -3.6% | +4.8% | May-Oct |
| 1995 | +9.0% | +13.0% | May-Oct |
| 1996 | +12.5% | +7.8% | Nov-Apr |
| 1997 | +13.6% | +14.1% | May-Oct |
| 1998 | +21.6% | -1.2% | Nov-Apr |
| 1999 | +21.5% | +2.1% | Nov-Apr |
| 2000 | +6.6% | -1.6% | Nov-Apr |
| 2001 | -12.6% | -15.2% | Nov-Apr |
| 2002 | +1.6% | -17.8% | Nov-Apr |
| 2003 | +3.5% | +14.6% | May-Oct |
| 2004 | +5.4% | +2.1% | Nov-Apr |
| 2005 | +2.4% | +4.3% | May-Oct |
| 2006 | +8.6% | +5.1% | Nov-Apr |
| 2007 | +7.6% | +4.5% | Nov-Apr |
| 2008 | -10.6% | -30.1% | Nov-Apr |
| 2009 | -9.9% | +18.7% | May-Oct |
| 2010 | +14.5% | -0.3% | Nov-Apr |
| 2011 | +15.2% | -8.1% | Nov-Apr |
| 2012 | +11.5% | +1.0% | Nov-Apr |
| 2013 | +13.1% | +10.0% | Nov-Apr |
| 2014 | +7.3% | +7.1% | Nov-Apr |
| 2015 | +3.3% | -0.3% | Nov-Apr |
| 2016 | -0.7% | +2.9% | May-Oct |
| 2017 | +12.1% | +8.0% | Nov-Apr |
| 2018 | +2.8% | +2.4% | Nov-Apr |
| 2019 | +8.6% | +3.1% | Nov-Apr |
| 2020 | -4.1% | +12.3% | May-Oct |
| 2021 | +27.9% | +10.1% | Nov-Apr |
| 2022 | -10.3% | -6.3% | May-Oct |
| 2023 | +7.7% | +0.6% | Nov-Apr |
| 2024 | +20.1% | +13.3% | Nov-Apr |
| 2025 | -2.4% | +22.8% | May-Oct |
Method. Daily ^GSPC closes pulled from Yahoo Finance back to 1950-01-03 (the longest continuous daily history this ticker has), resampled to the last trading day of each calendar month; the still-incomplete current month (2026-09-04) is dropped. Monthly log return = ln(closet/closet-1), n=919 after the first month (no prior close) is also dropped. The "market year" concrete comparison pairs each May–Oct block with the Nov–Apr block that precedes it (Nov and Dec of year Y-1 plus Jan–Apr of year Y count as "winter of year Y"), keeping only pairs where both six-month halves are fully observed — 75 such market-years, 1951–2025.
Limits, stated plainly. R²=0.008 on the monthly regression is small by design — a six-month cumulative drift, not a signal that predicts any single month's return, and not evidence this could be traded month-to-month without transaction costs eating the edge. 2002 is used as the split point because it is the paper's real, dateable publication year, not a cherry-picked inflection found by scanning the data for a break; a market that reacted to it does not have to react instantly, so some pre-2002 arbitrage or gradual decay before the formal split is possible and not separately tested here. The post-2002 window is 296 months across only 24 market-years — a real ceiling on how precisely this desk can measure whether the effect is gone, shrunk, or just noisier on less data.
sp500_monthly_531.csv (full monthly pull) · fit output (JSON) · table above is the 75-market-year comparison the concrete dollar figures are built from (bold rows are since the 2002 paper).
^GSPC daily history via yfinance, keyless · the claim itself: Sven Bouman & Ben Jacobsen, "The Halloween Indicator, 'Sell in May and Go Away': Another Puzzle," American Economic Review 92(5), 2002.
