28,221 Spotify tracks, six genres, 1970–2020. From 1970 to 2012, duration barely moves: 0.56 sec/yr, CI [-0.84, -0.27] — real but tiny. From 2013 on, the slope is 15.7× steeper: 8.7 sec/yr, CI [-9.45, -8.02]. An interaction test confirms the break is real, not two coincidentally different fits (p=4.9e-106). Every one of the 6 genres shows the same post-2013 acceleration.
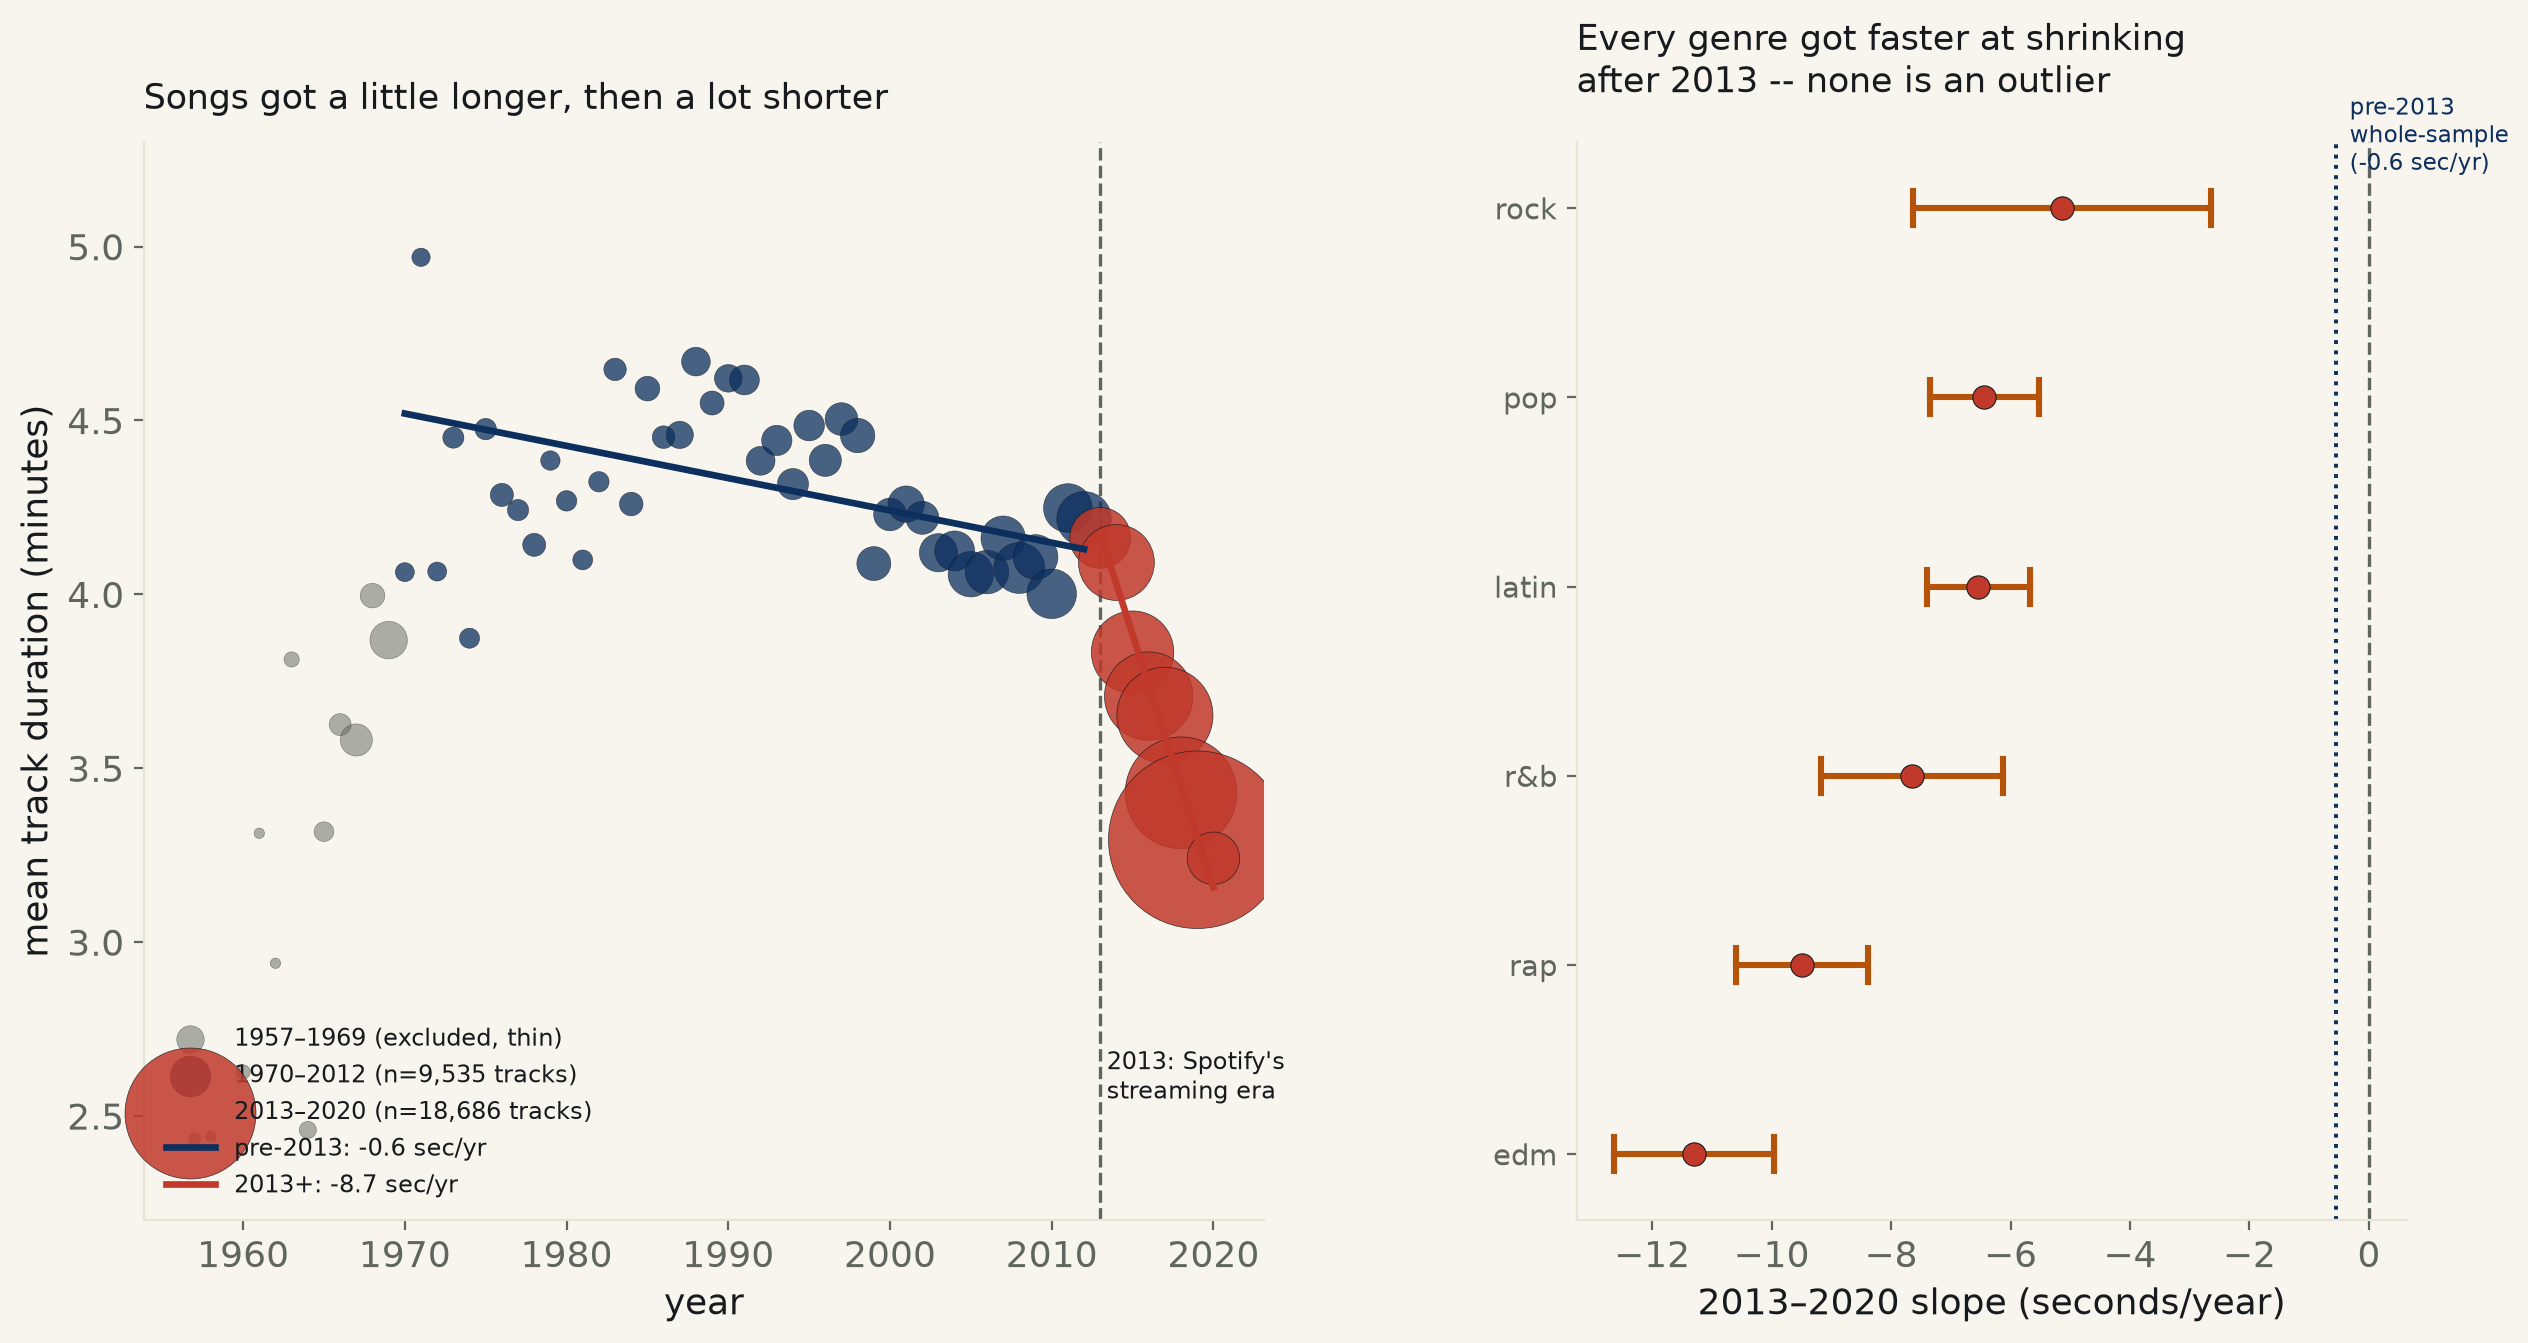
“Songs are getting shorter” circulates as a flat, always-true claim about the streaming era squeezing pop music down to fit an algorithm's attention span. The real shape, in 28,221 Spotify tracks spanning 1970–2020 across six genres, is not flat and not always-true: durations fell only a hair for four decades (−0.56 sec/yr), then the rate snapped hard and fast after 2013.
From 1970 to 2012, the trend is barely there. Mean track duration falls only 0.56 seconds a year, year-clustered 95% CI [-0.84, -0.27] sec/yr — real (the interval excludes zero) but tiny, R²=0.010. A year-block bootstrap agrees almost exactly (CI [-0.86, -0.29]). At that rate, four decades cost a song about 24 seconds — noticeable only if you compare the ends of a very long ruler.
Then 2013 arrives, and the slope doesn't bend — it snaps. 2013–2020: 8.7 seconds a year, CI [-9.45, -8.02] — a bootstrap over the 8 available years agrees (CI [-9.47, -7.59]). A formal interaction test, run on the pooled 1970–2020 data with an era indicator and its own slope term, confirms the two slopes are not the same line by chance: the post-2013 slope declines an extra 8.17 seconds/year faster than the pre-2013 one, 95% CI [7.44, 8.91] — excludes zero by a wide margin (p=4.9e-106). The post-break rate is 15.7× the pre-break one.
Concrete, no regression needed: mean duration fell in every single year from 2013 to 2020, eight years running, with no exception — 2013: 4.16; 2014: 4.09; 2015: 3.83; 2016: 3.71; 2017: 3.65; 2018: 3.43; 2019: 3.29; 2020: 3.24. A track from 2012 (mean 4.22 min) runs a full 59 seconds longer than one from 2020 (mean 3.24 min); the entire drop lands inside those 8 years, not spread across the 50 this pull covers.
Every genre shrinks after 2013 — none is carrying the other five. All six post-2013 genre slopes exclude zero on their own year-clustered CI: edm falls fastest (-11.3 sec/yr), rock slowest (-5.1 sec/yr) — both real, both far steeper than any pre-2013 whole-sample rate. This is not one genre's algorithm-chasing fluke reshaping the pooled average; it shows up independently in pop, rap, r&b and latin too.
The excluded years work against the “always been shrinking” story, not for it. 135 tracks from 1957–1969 are held out of every fit above — as few as 1 track and never more than 43 in any single year, the sparse 45rpm-single era this playlist-based sample barely reaches. Their own mean (3.60 min) is shorter than anything the 1970s–2000s show; the single longest year on record, 1971, averages 4.97 min. Read plainly: ends-of-range folklore (short early singles, a 1971 peak, then streaming-era drop) is not the pre-2013 OLS story — that slope already pointed slightly shorter (−0.56 sec/yr) before the post-2013 snap.
| Specification | year clusters | slope (sec/yr) | 95% CI (year-clustered) | 95% CI (year-block bootstrap) | R² |
|---|---|---|---|---|---|
| Whole robust window (1970–2020, n=28,221) | 51 | -1.85 | [-2.43, -1.28] | [-2.28, -0.98] | 0.108 |
| Pre-2013 (1970–2012, n=9,535) | 43 | -0.56 | [-0.84, -0.27] | [-0.86, -0.29] | 0.010 |
| 2013–2020 (n=18,686) | 8 | -8.73 | [-9.45, -8.02] | [-9.47, -7.59] | 0.092 |
| Interaction: does the slope change at 2013? (n=28,221) | — | -8.17 | [-8.91, -7.44] | — | excludes zero |
Year-clustered SE treats each calendar year, not each song, as one independent observation — the correct unit for a trend claim, since songs released the same year are not independent draws. The 2013–2020 window has only 8 such year-clusters, a real ceiling on how confidently that slope's precision can be trusted; the year-block bootstrap resamples whole years for the same reason and agrees closely.
| Genre | tracks, 2013–2020 | slope (sec/yr) | 95% CI | R² |
|---|---|---|---|---|
| edm | 4,492 | -11.29 | [-12.63, -9.95] | 0.111 |
| rap | 3,749 | -9.49 | [-10.59, -8.38] | 0.092 |
| r&b | 2,348 | -7.66 | [-9.18, -6.13] | 0.076 |
| latin | 3,013 | -6.54 | [-7.41, -5.67] | 0.067 |
| pop | 3,975 | -6.44 | [-7.35, -5.53] | 0.094 |
| rock | 1,109 | -5.14 | [-7.64, -2.64] | 0.037 |
Method. Every row is a real track from TidyTuesday's public 2020-01-21 release of Spotify Web API data (itself pulled via Kaylin Pavlik's spotifyr-based analysis, republished by the R for Data Science Learning Community), deduplicated to one row per unique track_id across the six genre-defining playlists it was sourced from (32,833 raw playlist placements → 28,356 unique tracks). 135 tracks from 1957–1969 are excluded from every fit: several of those years carry fewer than 15 tracks, the sparse 45rpm-single era before this playlist-based sample gets dense enough to trend on — kept in the raw CSV, excluded here with the reason stated, not silently dropped. The 2013 split point is Spotify's own streaming-era inflection (its subscriber base roughly tripled 2013–2015), named in this desk's own backlog before any fit ran, not searched for after seeing the data. Every regression here is OLS with year-clustered standard errors, cross-checked with a 4,000-draw year-block bootstrap that resamples whole years rather than individual tracks — because two songs released in the same year are not independent observations of a year-over-year trend, and a plain per-track OLS would overstate precision by orders of magnitude.
Limits, stated plainly. This is not a random or representative sample of all recorded music — it is every track that appeared on one of six Spotify-curated genre playlists as of early 2020, which skews recent by construction (2019 alone contributes 7,406 of the 28,221 fitted tracks) and covers only six broad genres, missing classical, jazz, country, and non-Western music entirely. The 2013–2020 window has only 8 independent year-observations for cluster-robust inference — a real ceiling, not papered over by the bootstrap agreeing, since both methods share the same 8-year limitation. This run measures what got playlisted, not every song ever released; genres or eras a curator excluded from these six playlists are invisible to it.
spotify_track_length_528.csv (full 28,356-track pull) · fit output (JSON).
| Year | tracks | mean duration (min) |
|---|---|---|
| 1957 | 2 | 2.434 |
| 1958 | 1 | 2.441 |
| 1960 | 4 | 2.626 |
| 1961 | 1 | 3.313 |
| 1962 | 1 | 2.939 |
| 1963 | 5 | 3.813 |
| 1964 | 7 | 2.460 |
| 1965 | 10 | 3.317 |
| 1966 | 13 | 3.625 |
| 1967 | 31 | 3.581 |
| 1968 | 17 | 3.996 |
| 1969 | 43 | 3.868 |
| 1970 | 63 | 4.064 |
| 1971 | 57 | 4.969 |
| 1972 | 63 | 4.065 |
| 1973 | 83 | 4.450 |
| 1974 | 73 | 3.874 |
| 1975 | 86 | 4.475 |
| 1976 | 104 | 4.286 |
| 1977 | 84 | 4.242 |
| 1978 | 103 | 4.142 |
| 1979 | 67 | 4.385 |
| 1980 | 77 | 4.269 |
| 1981 | 71 | 4.099 |
| 1982 | 76 | 4.324 |
| 1983 | 97 | 4.647 |
| 1984 | 109 | 4.260 |
| 1985 | 122 | 4.591 |
| 1986 | 99 | 4.452 |
| 1987 | 153 | 4.458 |
| 1988 | 172 | 4.669 |
| 1989 | 114 | 4.550 |
| 1990 | 158 | 4.621 |
| 1991 | 188 | 4.616 |
| 1992 | 174 | 4.384 |
| 1993 | 195 | 4.442 |
| 1994 | 207 | 4.317 |
| 1995 | 199 | 4.485 |
| 1996 | 222 | 4.385 |
| 1997 | 231 | 4.504 |
| 1998 | 257 | 4.456 |
| 1999 | 250 | 4.088 |
| 2000 | 230 | 4.230 |
| 2001 | 290 | 4.259 |
| 2002 | 235 | 4.220 |
| 2003 | 324 | 4.119 |
| 2004 | 354 | 4.125 |
| 2005 | 465 | 4.058 |
| 2006 | 425 | 4.064 |
| 2007 | 444 | 4.161 |
| 2008 | 590 | 4.076 |
| 2009 | 450 | 4.107 |
| 2010 | 558 | 4.001 |
| 2011 | 538 | 4.248 |
| 2012 | 678 | 4.217 |
| 2013 | 851 | 4.162 |
| 2014 | 1,334 | 4.091 |
| 2015 | 1,576 | 3.834 |
| 2016 | 1,823 | 3.707 |
| 2017 | 2,153 | 3.652 |
| 2018 | 2,917 | 3.429 |
| 2019 | 7,406 | 3.294 |
| 2020 | 626 | 3.241 |
