942 months of FRED's own federal minimum wage, CPI, and CPS employment-ratio series, 1948–2026. The theoretically cleanest test — the real minimum wage's level against teen employment's level, controlling for the decades-long trend both share for unrelated reasons — returns an elasticity of -0.058, 95% CI [-0.212, +0.096] — contains zero. Switch to month-to-month changes and a small negative effect survives every correction for serial correlation — but explains R²=0.0015 of the variance, about one part in 700.
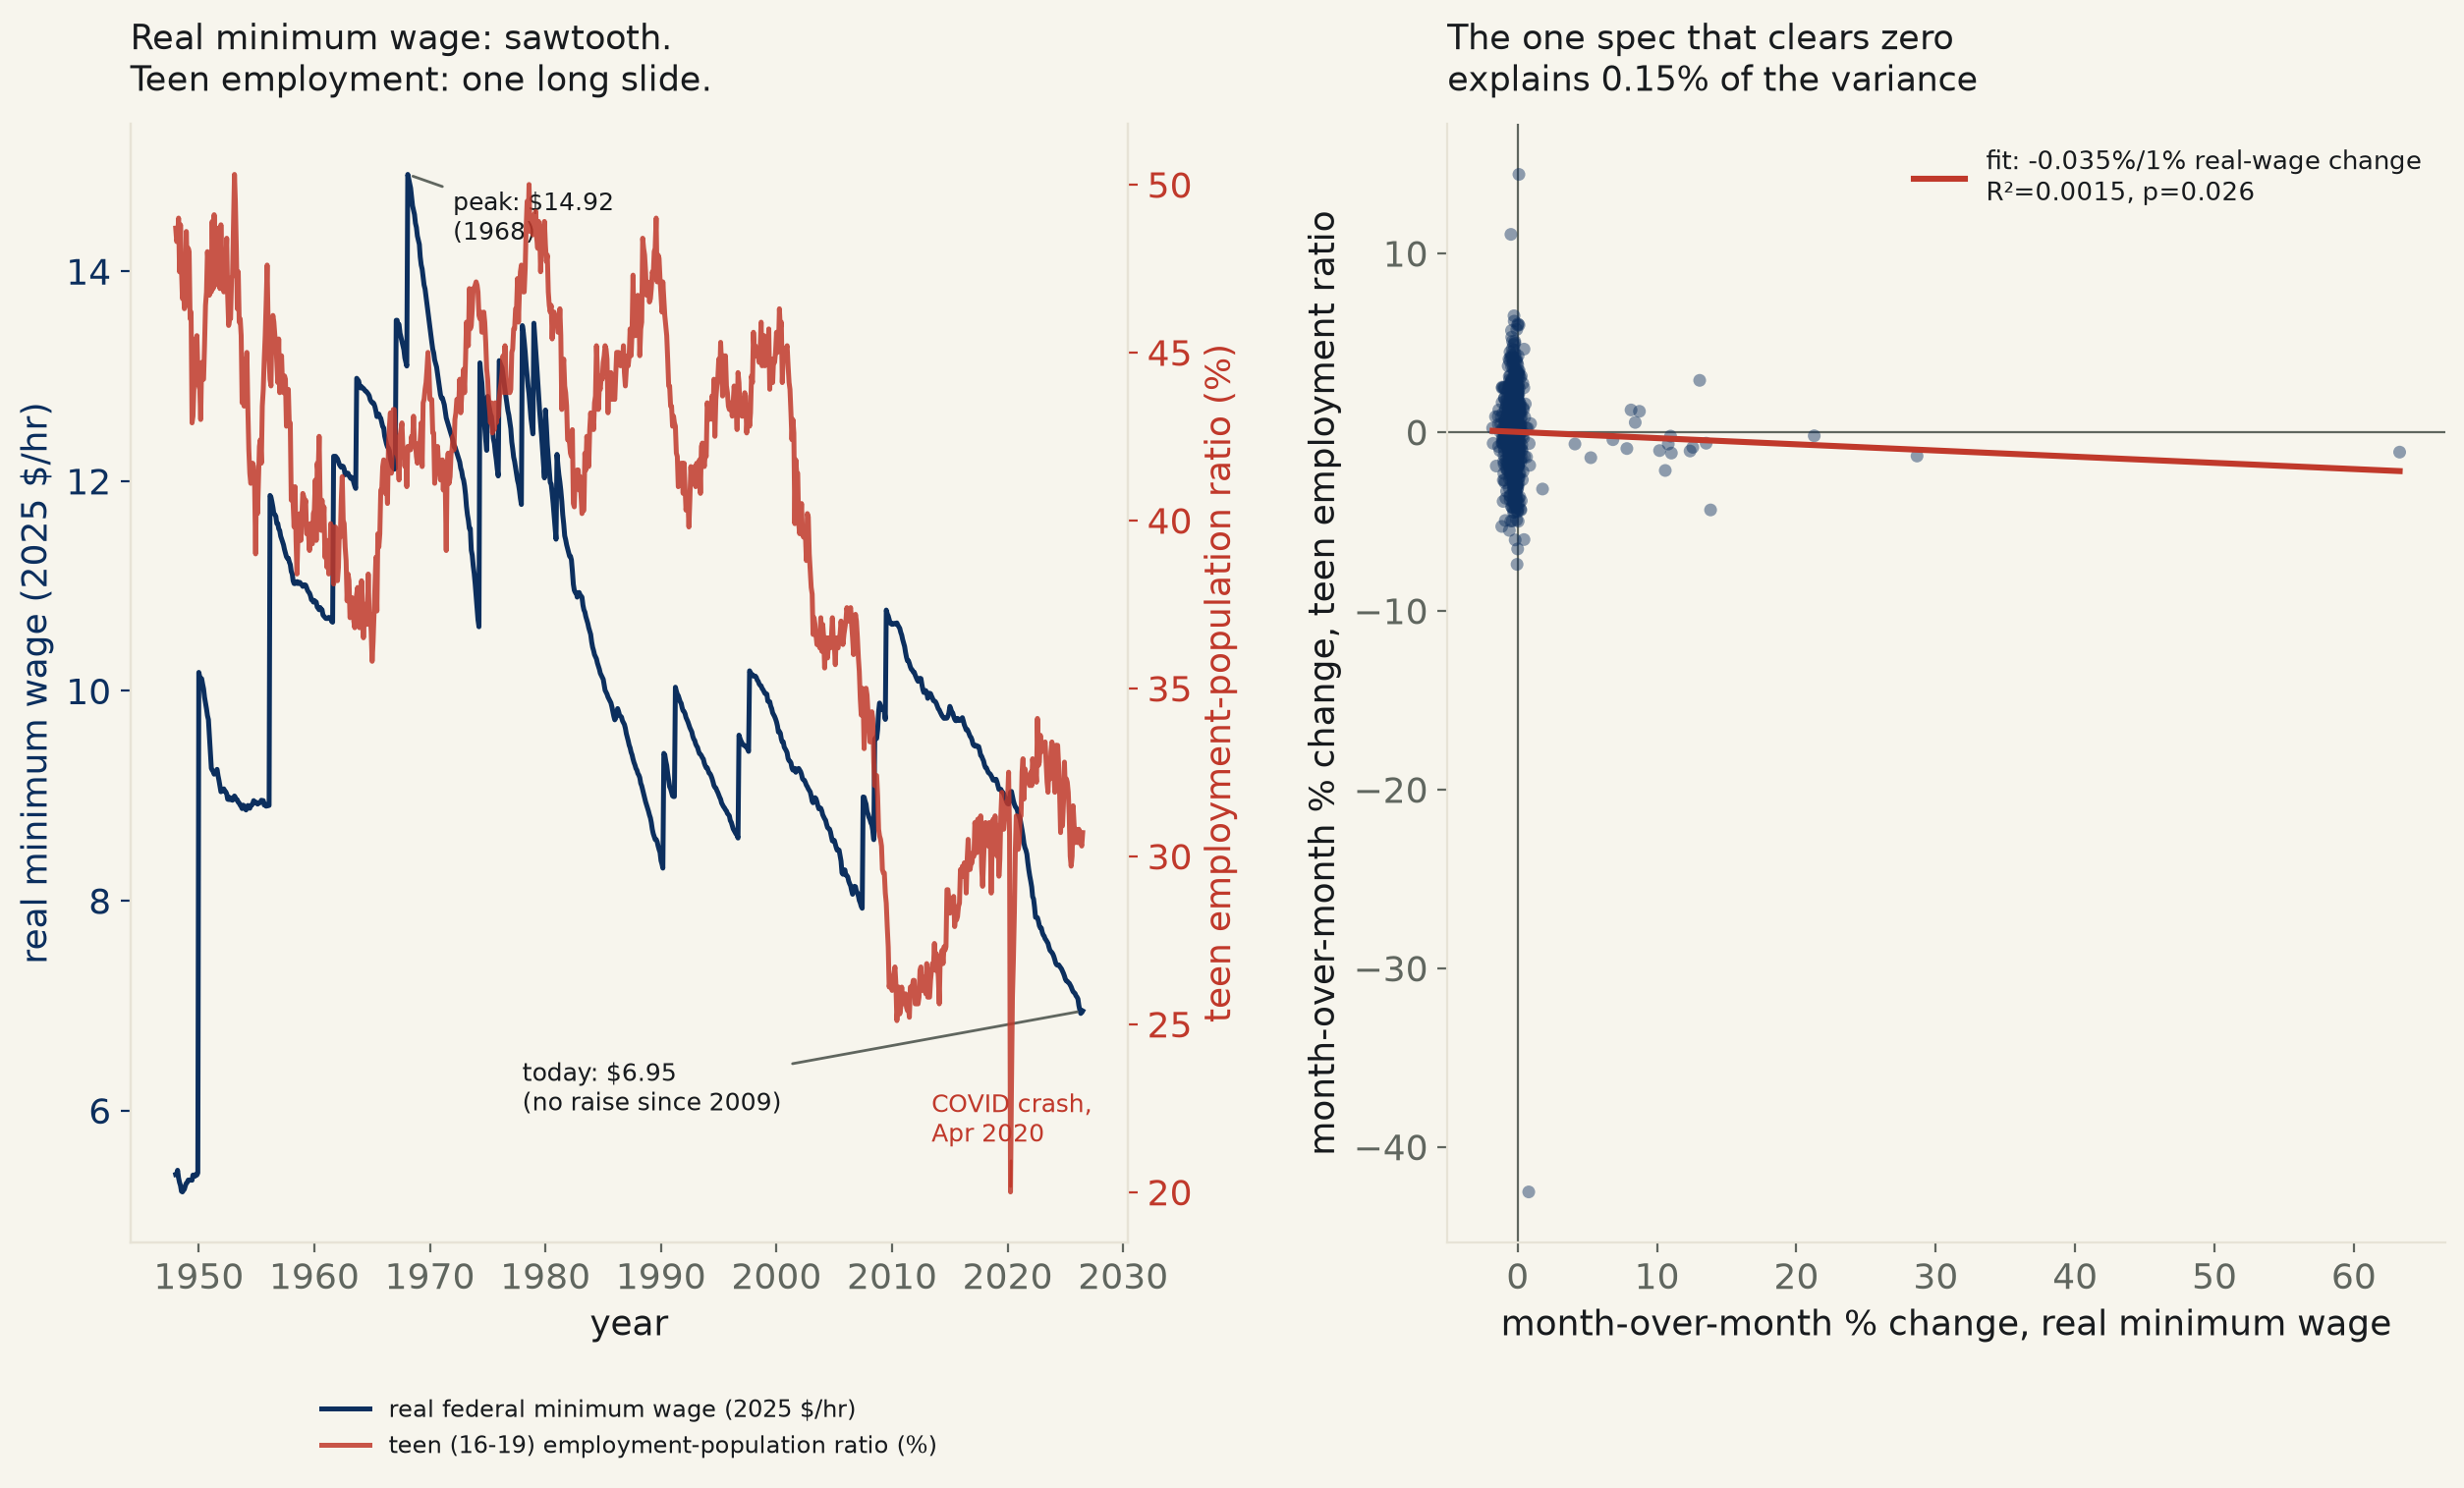
The federal minimum wage has been raised 20 times since 1948, always by legislation, never automatically — and never once cut. That step function is also this run's identification strategy: because Congress does not index the wage to inflation, its real, inflation-adjusted value erodes every month between hikes, then jumps at the next one. Deflating the nominal wage (FRED FEDMINNFRWG) by CPI-U (FRED CPIAUCSL) into 2025 dollars turns 20 legislated events into 942 months of continuously varying real minimum wage, 1948–2026, matched to the teen (16–19) employment-population ratio (FRED LNS12300012) and, as a same-business-cycle control barely touched by the minimum wage, the prime-age (25–54) ratio (LNS12300060).
The real minimum wage peaked at $14.92/hr in Feb 1968; today, after 203 months with no increase since Jul 2009, it is worth $6.95/hr in the same 2025 dollars — less than half its late-1960s peak, on a nominal wage ($7.25) that has not moved at all. Over the same 78 years the teen employment ratio fell from 48.7% to 30.7% — a decline this run does not credit to the minimum wage, since it runs through eras when the real wage was rising as often as falling, and the literature's leading explanation is a rise in the number of teens staying in school rather than working, not a labor-demand story.
A naive look gets the sign backwards. Regressing the teen employment ratio directly on the real minimum wage, with no control for the shared decades-long trend, returns a small positive coefficient (+0.765, 95% CI [-0.126, +1.655], p=0.09) — two declining series correlating by coincidence of era, not each other. Once a linear time trend is added — the headline, theoretically cleanest test — the sign flips negative but the interval widens to swallow it: elasticity -0.058 (a 10% real-wage increase associated with a 0.58% change in teen employment), 95% CI [-0.212, +0.096], R²=0.49, p=0.46 — contains zero comfortably. Replacing the outcome with the teen-minus-prime-age employment gap, which nets out recessions common to both age groups, agrees: -0.207 points per real dollar, CI [-0.602, +0.189], p=0.31. On the specification closest to how the claim is usually stated — does the level of the minimum wage predict the level of teen employment, trend aside — the desk cannot confirm it.
Switch from levels to month-to-month changes and a real, if tiny, effect turns up — fragile only at the least careful specification. Regressing the monthly percent change in teen employment on the monthly percent change in the real minimum wage, plain heteroskedasticity-robust (HC3) standard errors return a coefficient of -0.035 that does not clear zero (p=0.17) — but monthly employment data is serially correlated, and every correction for that agrees the same point estimate is real: Newey-West HAC at bandwidths from 3 to 36 months, year-clustered standard errors, and a 4,000-draw moving-block bootstrap all exclude zero (HAC-24 CI [-0.065, -0.004], p=0.026; bootstrap CI [-0.105, -0.011], 99.2% of resamples negative). It is not an artifact of April 2020's COVID employment crash, the single most extreme point in the series — dropping 2020 entirely barely moves it (-0.028, p=0.021).
Read the magnitude before crediting the sign. R²=0.0015 on the first-difference fit — the real minimum wage's monthly change accounts for roughly one part in 700 of the monthly variance in teen employment. And the effect does not survive lengthening the window: the identical test on 12-month changes instead of 1-month changes returns -0.073, CI [-0.187, +0.042], p=0.21 — contains zero. The classic fight over whether the minimum wage costs teens jobs does not resolve here into either side's headline: the cleanest, most theoretically motivated test cannot exclude no effect at all, and the one specification that can is real, direction-consistent with textbook theory, and economically negligible.
| Specification | coefficient | 95% CI | R² | p | verdict |
|---|---|---|---|---|---|
| Naive level, no trend control (n=942) | +0.765 $/hr | [-0.126, +1.655] | 0.0463 | 0.092 | contains 0 |
| Headline: level, log-log, linear trend, HAC(24) (n=942) | -0.058 | [-0.212, +0.096] | 0.4922 | 0.460 | contains 0 |
| Relative gap (teen − prime-age), trend, HAC(24) (n=942) | -0.207 pts/$ | [-0.602, +0.189] | 0.9332 | 0.306 | contains 0 |
| Monthly first difference, log-log, HC3 (n=941) | -0.035 | [-0.084, +0.014] | 0.0015 | 0.165 | contains 0 |
| Monthly first difference, log-log, HAC(24) (n=941) | -0.035 | [-0.065, -0.004] | 0.0015 | 0.026 | excludes 0 |
| Monthly first difference, year-clustered SE (n=941) | -0.035 | [-0.066, -0.003] | 0.0015 | 0.031 | excludes 0 |
| Monthly first difference, excl. 2020 (n=929) | -0.028 | [-0.052, -0.004] | 0.0016 | 0.021 | excludes 0 |
| 12-month change, log-log, HAC(24) (n=930) | -0.073 | [-0.187, +0.042] | 0.0127 | 0.213 | contains 0 |
HAC = Newey-West heteroskedasticity-and-autocorrelation-consistent standard errors. Bootstrap = 4,000-draw moving-block resample, 24-month blocks, applied to the monthly first-difference specification. "Excludes 0" means the 95% CI does not contain zero.
Method. All four series pulled from FRED's keyless CSV endpoint (fred.stlouisfed.org/graph/fredgraph.csv?id=<SERIES>), the same pull pattern used for runs 028, 110, and 501: FEDMINNFRWG (federal minimum hourly wage for nonfarm workers, monthly since 1938), CPIAUCSL (CPI-U, monthly since 1947), LNS12300012 (employment-population ratio, 16–19 years, seasonally adjusted), LNS12300060 (employment-population ratio, 25–54 years, seasonally adjusted). Real minimum wage is the nominal series deflated by CPI-U and indexed to January 2025 dollars. All four series are inner-joined on calendar month, 942 months survive, 1948-01 (LNS series start) to 2026-07 (latest common month); the fetch asserts the nominal minimum wage series never decreases (it does not — 20 increases, zero decreases) as a sanity check on the pull. Log-log specifications use natural log of both the real minimum wage and the employment ratio, so the fitted slope reads as an elasticity. First-difference specifications regress the month-over-month change in log teen employment on the month-over-month change in log real minimum wage; the 12-month version repeats this at a 12-month lag instead of 1.
Limits, stated plainly. This is a national aggregate time series, not the state-panel or county-border natural experiments (Card & Krueger 1994 and successors) that dominate the modern minimum-wage literature and that this run's own backlog entry originally envisioned — state-by-state historical minimum-wage panels are not available from a keyless source reachable in one day's pull, so this run tests the older, national time-series tradition (Brown, Gilroy & Kohen 1982) instead, and says so rather than presenting it as the newer quasi-experimental standard. A single national linear trend is a blunt control for teen employment's decline, which is not obviously linear across 78 years and plausibly reflects rising school enrollment more than any labor-market force this run measures directly; no enrollment data is joined in to test that mechanism. The first-difference specification that does clear zero is small enough (R²<0.002) that it would not survive multiple-comparison correction if this run had gone looking across many outcome variables for a hit — it did not; the four series above were fixed before any regression ran. Federal-only: no state or local minimum wages above the federal floor are in this data, understating the true policy variation for the majority of teens who by 2026 live under a state or city rate higher than $7.25.
